Wednesday, June 30, 2010

Chicago Purchasing Managers Index: Demand For Oil Dispersant Is Outstripping Supply

The Chicago Purchasing Managers Index (or Chicago Business Barometer) measures business activity in the Midwest.  The Chicago Business Barometer is an extremely timely index as it comes out right before the ISM manufacturing index (which comes out tomorrow).  On a month-to-month basis this index moves about 60% of the time with the ISM manufacturing index with a correlation close to 90% in the size of the change.

ISM-Chicago, an affiliate with the Institute for Supply Management, questions about 200 purchasing managers from Illinois, Indiana and Michigan on business activity in their districts.  Answers received are compiled and a diffusion index is produced based on a weighted average of the five sub-component indexes:
1) new orders - 35%
2) production - 25%
3) order backlogs - 15%
4) employment - 10%
5) supplier deliveries - 15%

How does one go about interpreting this index?
The diffusion index functions like the ISM manufacturing survey index:
A reading above 50 indicates expansion, while one below 50 hints at contraction

Here is what the latest report has to say:
"The Chicago Purchasing Managers reported the CHICAGO BUSINESS BAROMETER indicated the breadth of expansion showed little change, and chalked up a ninth month of growth."
The index read 59.1 for June as compared to 59.7 in May, which means that although business is still growing it is growing at a slower rate than last month.

In a look at how the Gulf Coast Oil spill has impacted the Midwest economy, one of the general comments at the end of the report noted that demand is outstripping supply for the chemicals used to create oil dispersant:
"There has been an increase in order time for products which are purchased to make finished products. This is related to the chemical industry and the requirements for many components used in finished fluids for oil dispersants used in the Gulf Coast Oil spill." 

Tuesday, June 29, 2010

Double Dip: Here We Go!

Jim Cramer is going to tell you that you need to stop trading tonight.

What's Confidence?

The Conference Board Consumer Confidence Index (CCI) fell sharply in June.  The index fell 9.8 points from 62.7% in May to 52.9 in June.  If you turn on CNBC you will notice a small panic and talk of supporting stimulus programs.  This is a pretty good sign that the recession is about to get nasty.  Also a look at the yield curve reveals that a contraction is forthcoming.

S&P Case-Shiller Home Price Index: Your Home Is Still Pretty Much Worthless

The S&P/Case-Shiller home price index tracks monthly changes in the value of residential real estate in 20 metropolitan regions across the U.S.  This index is based off of repeat transactions meaning it tracks the same homes from month-to-month and is calculated as a 3 month moving average to smooth out the volatility in the series.  The index is published with a two month lag so timeliness is a factor.   The latest report can be located here. 

This quarterly index captures approximately 75% of U.S. residential housing stock by value and covers single-family home prices for the nine U.S. Census divisions. In addition, the 10 and 20 city composite indices also measure single family home prices and are calculated monthly. Furthermore, the condominium indices track condominium prices in Boston, Chicago, Los Angeles, New York, and San Francisco. 

The repeat sales methodology used for the monthly index can be found here:
"The repeat sales methodology measures the movement in the price of single-family homes by collecting data on actual sale prices of single-family homes in their specific regions. When a home is resold, months or years later, the new sale price is matched to its first sale price. These two data points are called a “sale pair.” The difference in the sale pair is measured and recorded. All the sales pairs in a region are, then, aggregated into one index. Sales pairs are carefully screened for any data points that would distort the index, such as non arms-length transactions."
In layman's terms::
"The monthly S&P/Case-Shiller Home Price Indices use the “repeat sales method” of index calculation – an approach that is widely recognized as the premier methodology for indexing housing prices – which uses data on properties that have sold at least twice, in order to capture the true appreciated value of each specific sales unit."
Here is Detroit's depressing HMI:
Nationwide home prices seem to be improving:
"Data through April 2010, released today by Standard & Poor’s for its S&P/Case-Shiller Home Price Indices, the leading measure of U.S. home prices, show that annual growth rates of all 20 MSAs and the 10- and 20-City Composites improved in April compared to March 2010. The 10-City Composite is up 4.6% from where it was in April 2009, and the 20-City Composite is up 3.8% versus the same time last year. In addition, 18 of the 20 MSAs and both Composites saw improvement in prices as measured by April versus March monthly changes."
But this is not true because these numbers still reflect the effects from the home buyer tax credit.  Because of this next months release should shed some more light on the true state of home values.

Monday, June 28, 2010

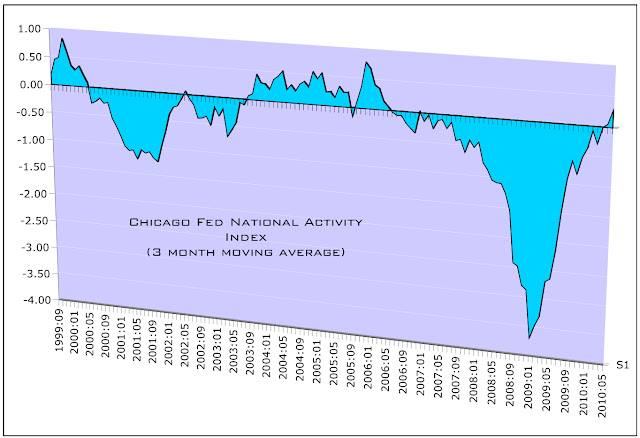
The Chicago Fed National Activity Index: The Economy Has Been Tested Positive For Contracting Recovery

What is this Chicago Fed National Activity Index(CFNAI) and what does it tell about the economy?  This index reflects the performance of 85 monthly national indicators drawn from four categories:
1) production and income
2) the job market and hours worked
3) personal consumption and housing
4) sales, inventories and orders

How does one go about interpreting the index?
A value of 0 means that the economy is growing at potential and inflation pressures are steady.  Greater than > 0 and demand outstrips supply and we see inflation pressures flare up.  Less than < 0 and the economy is growing below potential which can lead to rising unemployment.

The Chicago Fed National Activity Index was released today with the 3-month moving average reading 0.28.  What does that mean exactly?

First of all we like to look at the CFNAI-MA3 (3-month moving average CFNAI) because it is less volatile than the month-to-month value and revisions in the data have already been incorporated.  The following have been observed:

< -.7 = chance of recession has risen substantially
< -1.5 = in a recession
> 0.2 = recession likely over
> 0.7 = inflation is in danger of accelerating

A reading of 0.28 therefore implies:
0.2 < 0.28 < 0.7
Which in words means that the recession is likely over and the economy is in no danger of inflation.

Saturday, June 26, 2010

Confirm and Disprove Stereotypes With The OECD Factbook 2010

When you want to have some fun with economics it's nice to check out the OECD Factbook 2010 as it is loaded with awesome facts about the world.

 Apparently the "growing demand for highly skilled workers has led to global competition for talent" in other words Koreans are the best at science :

Source: OECD Factbook 2010

Credit Card Debt Has Been Declining But...

it's not due to reasons we would like.  "Total Revolving Credit Outstanding" is a fancy way of referring to the total amount owed by all U.S. consumers on credit cards. As you can see the U.S. consumer has a lot less debt on their credit cards then when before the recession started.  Unfortunately it reflects a lot of people just straight up defaulting on their credit cards.

The WSJ Real Time Economics blog highlighted this fact when referencing Americas shrinking current-account deficit:
"The latest data on the deficit, though, suggest the decrease is as much a reflection of Americans’ insolvency as it is a sign of a return to financial and economic health."
This is the incredibly lame American way:

1. Amount hysterically large amounts of credit card debt (expecting things to never change like your job, income, marital situation, ect)
2. Once times are tough buckle under pressure and default.

What needs to occur is increased financial literacy and education to prevent people from borrowing with the attitude "the sky is the limit".  Maybe for Lil' Wayne it is but not for most people, as the recent dramatic drop in debt shows.  The really pathetic thing here is that if incomes and home prices continued to increase we would still see a rise in credit card debt and not a scramble by people to pay down their debts.  Since we saw the opposite; we see a drop in debt because an increasing segment of the population is unable to afford the minimal interest rate payments on their exploding debt so they are forced into default.

Friday, June 25, 2010

A Journey Through New Keynesian "Sticky-Wage" Theory

A decrease in aggregate demand leads to a reduction in some combination of wage rates, employment, and hours worked per employee.  It the demand for a firms output falls substantially, a firm must either reduce its employment, average weekly hours worked or average hourly wage rate.  Quit rates decline during recessions because few jobs are available at other firms.  The standard New Keynesian explanation tells us that when we experience a decline in aggregate demand firms will likely lay off employees and reduce average weekly hours worked rather than resort to a reduction in wage rates.  This is due to the employees strong resistance to wage cuts.  On our journey we will see various things that confirm and confront this theory.

First a look at average hourly earnings:
 Notice how wages go up in recessions? These wage increases are remarkable given how low our inflation has been.  Aren't wage increases supposed to increase inflation? To see if this relationship holds we must plot inflation and wages on the same graph.  We should see average hourly wages and inflation rise at the same time:


This relationship is strikingly dead on.  Except we do see that recent dip in the CPI which reflects how layoffs (or a decline in civilian employment) resulted in the drop in aggregate demand:

Another thing to note is average weekly hours worked.  According to the theory average weekly hours worked would decrease while employment started to decrease and vice-versa:

Unemployment insurance is also said to provide an incentive for firms to lay workers off rather than reducing their pay:

GDP Numbers Revised Downward

"Real gross domestic product -- the output of goods and services produced by labor and property located in the United States -- increased at an annual rate of 2.7 percent in the first quarter of 2010, (that is, from the fourth quarter to the first quarter), according to the "third" estimate released by the Bureau of Economic Analysis. In the fourth quarter of 2009, real GDP increased 5.6 percent."
The 2.7% is a .3% revision downward from the "second" estimate and a .5% downward revision from the "advance" estimate.   

Wednesday, June 23, 2010

Double-Dip: Financial Conditions Index Shows Pre-Lehman Reading

Check this out.

May New Residential Sales Drop 32.7% From April

This is not a positive sign as it will probably lead to a further drop in construction of new homes.  300,000 new homes were sold in May which is a 32.7% drop from April's numbers.  For the Current Press Release.  It is now estimated that it will take 8.5 months for all new homes to sell given current inventory and sales, this is a significant jump from last months 5.8 months.  We have also seen a drop in the amount of homes for sale.  One possible explanation: depressed housing values and demand has led to home builders waiting for current inventory to clear and demand to pick up.  This is not good news for durable goods producers as it means depressed demand for all the things that usually go along with a new house.

Reactions to the data from WSJ can be found here.

Tuesday, June 22, 2010

National Association of Realtors: Exisiting Home Sales and Western Speculation

The National Association of Realtors reports that home sales were down for the month of April but
incomes during the recession may be starting to stabilize and we may see demand pick up down the line.  Homes are still available at near fire-sale prices and are extremely attractive- especially with low 20 and 30 year mortgage rates.
Here is the press release.  The importance of this release is that it confirms the home sales were down.  Looking at the sortable chart we see existing home sales were down 2.2% since last month (although up 19.2% from this time last year).  Take note of the "Inventory*" and "Mos. Supply" columns-  an average of 8.3 months to clear all inventory is still about 2 months longer than conditions found in a balanced market.  Also inventories are up 1.1% from last year which indicates that conditions are really not improving much. 

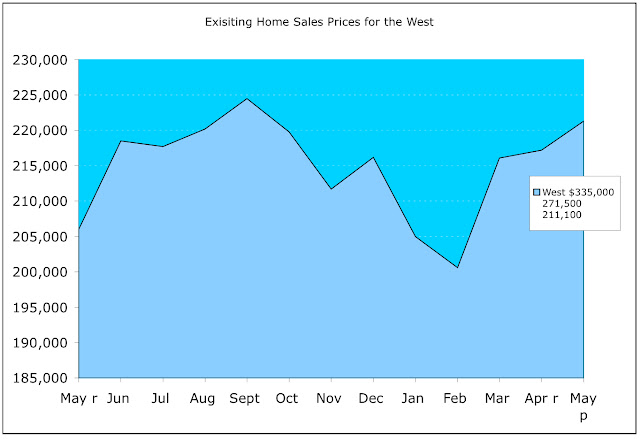
On a positive note if you look at the table below titled "Sales Price of Existing Homes" you will see that sales prices for existing homes are up 2.7% from last year. Now go to the following table on Existing Single Family Home Sales.  Here we see a 1.6% drop in home sales since last month which suggest that the single-family home market may be cooling down.  It is important to see that this part of the housing market has been improving faster than the rest of the residential market as it may be a precursor of good things to come.  Compare 7.8 months to clear inventory to 8.3 months to clear inventory for the market as a whole.  It is interesting to note here the sales price of existing single family homes.  Compare the West to the rest of the country:

Can one say that the California housing market is one speculative bubble? The West experienced a 9.5% not seasonally adjusted and 7.4 seasonally adjusted increase in home sales prices (since last year) as compared to more modest increases (0.1% from the Northeast, Midwest 1.6% and South 2.6%) from the rest of the country.  I wonder where the next real estate bubble will start...

Monday, June 21, 2010

The Future of Financial Regulation: Lessons from Adam Smith

Does addressing too big to fail mean also accepting a lower standard of living? In the short-term yes (greater regulation + higher capital requirements) but in the long-term definitely not (because it will hopefully prevent financial crisis).  Does it mean eminent collapse of the financial system as we know it? No, but it does mean slower growth and credit constraints.  Will regulation end macroeconomic fluctuations? No, but if done correctly and maintained adaptively we will most certainly curtail them from happening as frequently or as violently as they do. 
We need a Federal Reserve that maintains price stability and financial stability.  The success of maintaining price stability has been proven with the “Great Moderation.” This refers to a time period of over 20 years when there was price stability and mild recessions.  The one thing that slipped under everyone's nose (except of coarse Hyman P. Minsky's) was - in fact - in plain sight.  The idea that human beings live for self-preservation is something that Adam Smith first mentioned in his classic The Theory of Moral Sentiments:
“Every man is, no doubt, by nature, first and principally recommended to his own care; and as he is fitter to take care of himself than of any other person, it is fit and right that it should be so.”(Section 2, Ch. 2)
Put straightforwardly: people always do things for themselves, sometimes even at the expense of others.  Every action we take is out of our own self-love and as a result man will forever exploit the system in finding ways (not necessarily moral) to make money:
“In the same manner, to the selfish and original passions of human nature, the loss or gain of a very small interest of our own, appears to be of vastly more importance, excites a much more passionate joy or sorrow, a much more ardent desire or aversion, than the greatest concern of another with whom we have no particular connection.  His interests, as long as they are surveyed from this station, can never be put into the balance with our own, can never restrain us from doing whatever may tend to promote our own, how ruinous soever to him.”
Rational expectations theory suggests that everyone is always making the best decisions given that the information they have is perfect.  This so-called “perfect information” as we have seen is an extremely unrealistic assumption.  Asymmetric information does exist so I cannot agree with the idea of perfect information.  People are rational and are always seeking out the most advantageous position for themselves given the limited and incomplete amount of information available to them.  It is because people are rational (but lack perfect information) that we experience bubbles (or for all you fancy cats; "asset inflation").  Since we are all looking for the quickest buck (and you can't deny that people on all sides of this crises were looking to get rich and make that money) and are rational is why we had a bubble.  Given the fact that people are rational there will never exist perfect information.  Profit driven entrepreneurs will prevent information from being "perfect" as a barrier to entry into a market or the "in crowd." It is in our interest to prevent others from looking in and seeing what we are doing.  I don't want people to look into my business and observe how I make my money because that means less producer surplus for me as they free ride all over my hard earned intellectual work.  Furthermore, information costs money and once it is purchased it can be subject to the free-rider problem. 

Now we ask ourselves:
What is the real problem and cause of crisis and how do we minimize the possibility of "it" happening in the future?  Does the problem lie in asymmetric information or in the fundamental lack of regulation?

So we hit the fork in the road- either we deal with all these asymmetric information problems or we deal with what they lead to.  I vote we deal with what they lead to because I still prefer some privacy when it comes to making my money (and it is impossible to eliminate asymmetric information).  This is where regulation comes in. 

Regulators -if given the right tools and information collecting ability- will be able to see the whole picture.  If power (and by power I mean a HUGE MAGNIFYING GLASS) is properly given to them, they will be the insider and the outsider.  They will be able to see the whole picture and the frame, not just one side of the story that the majority gets exposed to.  When the Fed did the stress tests (or Supervisory Capital Assessment Program as it was formally known) it reduced the uncertainty and information failures that were present in the market.  It was able to say (by bundling a group of banks and without naming names) that some of these banks are required to improve their capital positions.  This did miracles to reduce the uncertainty surrounding the liquidity positions of the banking industry.   
We also see how increasing information helps bring asset prices back to fundamental values.  Hence the boom- a period when more people are misinformed than informed- and the bust - when information becomes available (to the majority) that should have been available from the get-go.  If all the information on derivatives and sub-prime mortgage backed securities were readily available and extremely transparent we would not be in this predicament.  But we can't make all the information needed available! Why? Information costs too much and no one would pay for it due to the free rider problem.  Does it cost more than a financial meltdown? Perfect information would be a perfect insurance policy against global meltdown. 

The Federal Reserve should be the regulator of all regulators as it is in an ideal place to monitor systemic risks from all angles.  In order to get the whole picture (and not a ripped piece of a shredded photo) the Fed needs to be everywhere there is money.  Not to impede with Americans rights, but just to take a look around and make an independent assessment of the situation.  The only way this can go wrong is if regulators are bribed or purposely misled.  To avoid being misled, greater surveillance will allow the Fed to check facts with multiple sources to see if everything adds up.  The Fed could regulate groups of firms without ever revealing any information about those firms, or they could regulate all firms and reveal all information about every firm. 

That being said Congress should abandon the Federal Reserve mandate of full employment and add financial stability alongside the price stability mandate.  Fredric S. Mishkin argued against output stabilization in the conduct of monetary policy in his Monetary Policy Strategy (2007): 
 "1. Too great a focus on output fluctuations may produce undesirable outcomes: greater fluctuations of output and inflation around their targets. 
2. On the other hand, monetary policy that targets inflation is likely to produce better outcomes for both output and inflation fluctuations.
3. In addition, language which stresses output goals can make a central bank’s communication strategy less effective and can, thereby, weaken monetary policy credibility.  
4. A communication strategy that, instead, focuses on the control of inflation, is likely to make it easier for the monetary policy authorities to focus on the long run, thereby enhancing monetary policy credibility.”
The Fed already uses the three rates it has (interest on excess reserves, federal funds rate, discount rate) to their maximum potential.  To force the Fed (by law) to maintain full employment with the interest rate is upsetting.  The effective federal funds rate can only go so low before a liquidity trap ensues at the zero bound.  The Fed was pressured by Congress to maintain too low of rates for too long in the first place to help bolster home ownership.  This resulted in the Fed reaching the zero bound rather quickly when the crisis hit, thus impairing the ability of the interest rate channel.  The Fed cannot control the level of employment and at the same time maintain the price stability and financial stability mandate.  They really should abandon the full employment mandate as it leads to harmful discretionary policy.  The full employment mandate also subjects the Fed to additional scrutiny from Congress thus threatening both its independence and credibility.
  Congress should be the ones that have a full employment mandate as government stimulus leads to more jobs created directly (and with shorter policy lags) not indirectly through the slow moving transmission mechanisms of the interest rate.  The Fed should have two main objectives: price stability and financial stability.  Otherwise there is a severe conflict of interest as the Fed gets politicized and slowly loses its independence.

Sunday, June 20, 2010

Things Which Show Long-run Inflation Expectations

A little background:

From Monetary Policy Actions and Long-Run Inflation Expectations by Michael T. Kiley:
"the degree of anchoring of inflation expectations is central in most empirical and theoretical applications – as inflation is a function of inflation expectations..."

It is important for us to know about future inflation so we need to gauge long-run inflation expectations.  In theory firms price inflation into labor contracts and this sets the actual rate of inflation.  So by looking at current long-run inflation expectations we can see what inflation will be in the future. 

1)  "Sticky Price" CPI :
Produced by the Atlanta Fed and research on it by the Cleveland Fed.

2) Gold and other commodities:
If you ever look at the real price of gold vs. University of Michigan's Inflation Expectations Survey  you will see what I am talking about.

3) Difference between Nominal and Inflation Indexed Bonds:
The difference is expected inflation as it moves in response to news about the economy.

4) Survey of Professional Forecasters:

http://www.philadelphiafed.org/research-and-data/real-time-center/survey-of-professional-forecasters/2010/survq210.cfm

5) University of Michigan Survey of Inflation Expectations:

This shows inflation expectations for the next 12 months.

Things which impact inflation expectations include monetary policy and output.  Tighter monetary policy lowers inflation expectations while looser monetary policy traditionally raises inflation expectations.  Furthermore, higher levels of output raise measures of inflation expectations.

An Interesting Look At Contagion Risk

The Levy Institute's Multiplier Blog and EconBrowser highlight an awesome paper by the Bank For International Settlements.  Page 19 of the quarterly report has a graphic titled "Exposures to Greece, Ireland, Portugal and Spain, by nationality of banks"
It is definitely worth a look:

Please note France, German and United Kingdom exposure.

Paying Interest On Excess Reserves: From Theory To Practice

What is paying interest on excess reserves? It's a tool that the Fed created and has been using since October 1, 2008 to keep inflation in check.  The interest on excess reserves is the rate that the Fed pays depository institutions to keep excess reserves with the Fed.  The theory goes that by holding interest on excess reserves above the federal funds rate, there is an opportunity cost that is created which is the difference between the two interest rates.  FRED allows you to see this theory work in practice:


Notice that interest paid on excess reserves (the blue diamond line) has been at .25% and how an increase (decrease) in effective federal funds rate (red line) relative to interest on reserves leads to decreasing opportunity cost (increasing opportunity cost) associated with holding those excess reserves.  We have been observing that a decrease in the effective fed funds rate (relative to interest on excess reserves) leads to increased holdings of excess reserves (green line).  Many economists believe (including myself) that this Federal Reserve tool has been a main reason for inflation being subdued. 

Relationships Don't Last Forever: A Story of Divorce

Economist's View recently pointed out the relationship between capacity utilization and unemployment.  This graph shows the relationship of capacity utilization vs. unemployment:


An increase in  capacity utilization is usually immediately followed by a decrease in unemployment.  Economist's View makes the claim that :
"That is, in past recessions an upturn in capacity utilization was matched by an upturn in employment, there was no delay in the relationship, but in recent recessions there has been about a half year delay before unemployment reacts to changes in capacity utilization (or perhaps even a bit longer)."
We can definitely see this delay in the 2001 recession.  Notice how capacity utilization turns up and unemployment is initially very slow to drop.  The argument is being made that we are going to see the same thing this time around, where capacity utilization rates improve but unemployment won't drop for at least half a year.

A look at housing starts vs. unemployment:


Residential investment usually pick up at the end of a recession but not this time because of excess housing inventory.  There are too many existing properties for sale so we are not going to see strong housing starts data for a while.  This may lead to a slow decline in the unemployment rate as a growing housing sector usually creates jobs.

Calculated Risk explains the following:
"Usually housing starts and residential construction employment lead the economy out of a recession, but not this time because of the huge overhang of existing housing units. After rebounding a little in early '09, housing starts have mostly moved sideways"

Saturday, June 19, 2010

Future Looking "Sticky Price" CPI Shows Disinflation

Okay slow down! What do all those fancy words mean?

 As one Economic Commentary from the Federal Reserve Bank of Cleveland states the "sticky price" CPI :
"are “sticky,” which means that they may not respond to changing market conditions as quickly as other, more “flexible-price” goods. And because sticky prices are slow to change, it seems reasonable to assume that when these prices are set, they incorporate expectations about future inflation to a greater degree than prices that change on a frequent basis."
  Inflation is an increase in the price level and disinflation is a slowing in the rate of inflation.
The Atlanta Fed's Inflation Project reports the most recent numbers suggest disinflation:

"In May the flexible cut of the CPI declined at an 8.4 percent annual rate, the largest such drop since December 2008. Excluding food and energy, flexible CPI rose 5.5 percent (annual rate) and is up 1.6 percent from year-earlier levels."

Xavier Althletes Shouldn't Feel So Special: Everybody's Doing It

My old friend the Wall Street Journal Real Time Economics Blog highlighted a paper that describes the growing disparity between spending on college athletes and spending on students.  Spending on athletes grew 38% from 2005 to 2008, increasing to a median $84,446 per athlete in 2008 vs. $61,218 in 2005.  While median spending on other students increased by only 20% over the same time period from $11,079 in 2005 to $13,349 in 2008.

Friday, June 18, 2010

Insight Into Tackling the Debt: Lessons From Successful Monetary Policy

The U.S. Congress is notorious for not caring about budget deficits - even when the rest of the world is collapsing around them and central bankers are screaming at them.  This can be verified by the fact that 1835 was the last time our public debt was zero in this country.  There are four different government agencies- Government Accountability Office (GAO), Congressional Budget Office (CBO), Office of Management and Budget (OMB), and U.S. Treasury Department- that warn Congress of long-term structural problems annually.  The problem is that the government's entitlement programs (Social Security, Medicare, Medicaid etc.) will exceed tax revenues in just a few short years.  The main issue though is not the actual size of the government debt (because technically the U.S. government could borrow indefinitely) instead it's the instability and the loss of confidence that occurs at a given level of debt (the WSJ's Number of the Week column highlighted this).  How can we get the U.S. Federal Government on the road to fiscal sustainability? At the same time how could we possibly improve the government's credibility and transparency so that a crises of confidence never ensues?

I borrow lessons from monetary policy to help illustrate a possible solution:

In monetary theory, there is something called the time-inconsistency problem (for a nice explanation from Greg Mankiw).  The idea is that monetary policy conducted on a discretionary, day-by-day basis leads to poor long-run outcomes.  Monetary policymakers are tempted to pursue a policy that is more expansionary than firms or people expect because such a policy would boost economic output (or lower unemployment) in the short-run.  This model can be applied to Congress which frequently exploits the long-run trade off with the "expansionary policy today worry about long-run fiscal structural deficits later" model.  Although these entitlement programs help a lot of struggling people today (and help certain politicians get re-elected), the debt that is being accumulated will threaten the financial stability and dominance of the United States in the future.

The solution that is offered to the time-inconsistency problem is something called a nominal anchor.  A nominal anchor can be anything that signals to the public that policy is being followed according to plan or is being deviated from.  Putting in place a strong nominal anchor on the United States budget deficit can help prevent the time-inconsistency problem by providing a constraint on expansionary discretionary policy.  A strong nominal anchor can help ensure that the U.S. Congress will focus on the long-run and resist the temptation (or political pressures) to pursue short-run expansionary policies inconsistent with the long-run fiscal sustainability goal.

We can apply the idea of a rule based nominal anchor from monetary policy to the United States debt. 
A "Taylor Rule" for the deficit could be used to determine safe thresholds and would be able to enforce itself.  Although the Federal Reserve does not follow an explicit rule, it has a long history of maintaining price stability for which is has been deemed credible by the markets.  Also economists will frequently use a Taylor like rule to monitor and judge the Fed's performance which provides a check on the Fed.  A rule based deficit target that is mandated by law would increase the level of transparency and accountability needed to reduce the long-term structural debt.  This rule would create a visible and transparent budget constraint for the Congress.  Although theoretically the budget constraint is the amount of tax revenue a government receives and the amount of interest it has to pay on government debt.  The ultimate budget constraint is the threshold at which the U.S. could suffer a crises of confidence and default on its debt.  Like most households which have a limit as to how much they can spend, a rule based deficit number would provide an effective limit as to how much Congress spends.  It would also help Congress politically insulate itself when it comes to justify unpopular decisions such as reducing or eliminating several of the entitlement programs.

A basic principle of democracy is that the public should have the right to control the government's actions.  In a democracy, the public must have the capability to punish incompetent policymakers to control their actions.  If policymakers cannot be punished in someway then our basic principle of democracy is violated.  Accountability is also important because it promotes government efficiency.  Being subject to sanctions makes it more likely that incompetent policymakers will be replaced by competent ones.  This also creates better incentives for policymakers to do their job well.

Whenever Congress deviates from the rule, the public media and the Fed (or other politically insulated government bodies) could cut Congresses spending binges off.  Deviations from the rule would automatically subject members of Congress to a public hearing held by the Federal Reserve, Treasury Department and the GAO.  It would literally force Congress to explain each dollar spent over what the rule suggests as sustainable and thus result in greatly improved transparency.  This would also allow the Congress to gain back some credibility and therefore lead to reduced uncertainty about the long-term structural deficit.  A crisis of confidence can only occur if there is uncertainty and I would argue there is much uncertainty around the government's long-term stance on fiscal sustainability.  This would be a nice preventive measure against a sovereign default because it would constantly reinforce confidence in the ability and more importantly willingness to repay.

Thursday, June 17, 2010

Federal Reserve Bank of Philadelphia's Business Outlook Survey: And A Little Bit Slower Now

First of all what is this?

It is a survey of manufacturing activity in eastern Pennsylvania, southern New Jersey, and all of Delaware.  Having started in 1968, it is the longest running survey of manufacturing by any Federal Reserve Bank.

So why are we looking at it?

This report is recognized for its timeliness, because the results are published in the same month it covers.  The region this Federal Reserve district covers is one of the most populated in all of the U.S., which gives it the extra-umph we need to care.  Furthermore, it's like the Empire State Manufacturing Survey because the Business Outlook Survey can provide a hint towards what the ISM Manufacturing Survey might show less than two weeks later.

So what exactly do they do?

At the beginning of each month the Philly Fed  mails out questionnaires to the top executives at 250 large firms.  They are asked about present conditions and their expectations for the next 6 months.  Responses are received by the tenth of the month with about half of the questionnaires returned on time.  The Philly Fed then comes up with a diffusion index (the percentage of all positive scores minus the percentage of the scores that are negative) which is interpreted the following way: A zero and we have half the responses reporting an increase and the other half reporting a decrease in manufacturing activity.  Above zero points to an expansion being under way, below zero and we're looking at a contraction.

Here is the most recent Business Outlook Survey 

First we should look at the General Business Activity Index. Why? Because it has maintained a fairly close correlation with the manufacturing ISM series.  A word of warning is that this index can be volatile, so any conclusions should be based on a three-month moving average.  Looking at the table we see that manufacturing is certainly slowing down, dropping from a reading of 21.4 in May to 8.0 in June.

Second take a look at the Six-Month outlook:
In this section first look at Capital Expenditures as it indicates whether business will be willing to expand or not in the next 6 months.  As you can see it fell from a rather anemic 7.7 in May to an even slower rate of expansion of 3.0 in June.  This is not a good sign because it means manufacturers are not confident that demand will be coming back from the dead (at least not any time soon). 
The second thing to notice here is the Number of Employees which is a positive 19.5 so manufacturers will still be looking to hire in the next six months but at a slower rate than previously expected (30.1).

Overall the results of this survey are rather disappointing as they foreshadow disaster for the ISM Manufacturing Survey. From the Philly Fed website on the labor market deterioration:
"Until this month, firms’ responses had been suggesting that labor market conditions were improving, but indexes for current employment and work hours were both slightly negative. For the first time in seven months, more firms reported a decrease in employment (18 percent) than reported an increase (17 percent). The largest percentage (62 percent), however, reported steady employment levels. The workweek index also declined into negative territory, its first negative reading in eight months"

I Would Nominate Frederic S. Mishkin's "Money, Banking and Financial Markets" for Textbook of the Year

Some people argue otherwise

I would agree that the textbook does not offer every single business cycle theory out there, but it is not supposed to.  The cover says "The Economics of Money, Banking and Financial Markets".  These are the three things that the book focuses on and does an excellent job of explaining.

Wednesday, June 16, 2010

Industrial Production and Capacity Utilization

You may be wondering: What is Industrial Production and Capacity Utilization?  The Industrial Production series measures changes in the volume of goods produced.  This series is important because manufacturing activity is highly sensitive to interest rates and demand, so it closely parallels shifts in the overall economy.  Also it doesn't take the price of these products into consideration so there is no distortion in the numbers from inflation.  Furthermore since this makes it a pretty nice measure of output it correlates reasonably well with real GDP (Real GDP is nominal GDP adjusted for inflation).

To understand the meaning of capacity utilization think about a firm that has the capacity to manufacture 100 airplanes a year but is currently only producing 70 airplanes- it has an operating capacity utilization rate of 70%.  Now just imagine this for the whole economy and you get a sense of what it is.  The Federal Reserve's definition of capacity is based on what is considered the normal operating time for each industry. 

The current capacity utilization rate (for May) is 74.7 and at this rate there is not much reason for firms to hire additional workers (but may lead to extended average hours worked and overtime pay) because there is currently not enough demand to purchase what can easily be produced.  On a positive (and deflationary note) this capacity utilization rate is about 10% lower then where it needs to be for inflationary pressures to flare up.  The good news is that we are indeed producing more as the capacity utilization rate has been edging upward over the past few months. 

For the most recent report:
 http://www.federalreserve.gov/releases/g17/Current/

Housing Starts Data: Not A Surprise

For X.U. Economics blog readers the drop in housing starts does not come as a surprise but is still discouraging.  Yesterday we looked at the Housing Market Index which warned us that this would happen.  Housing Starts and Building Permits data essentially just records the number of new homes being built and permits being issued for future construction.

When browsing over the data it is important to note the performance of "single-family housing start" as opposed to "multi-family starts." This is because single-family home building is based on consumer confidence and demand, while construction for multi-unit apartments can be subject to speculation and changes in the tax code.  The most recent release indicates only 468,000 single-family housing starts in May as compared to the slight pick-up of 565,000 found in April's release ( Current New Residential Construction Press Release).

 One possible explanation is the disappearance of the home-buyers tax credit and with it a vanishing act by demand.  Another reasonable explanation is that growing families are looking to rent as opposed to purchasing a new home- especially with job stability being a hard thing to count on.  Whatever the reason may be the drop in single family housing starts is not a good sign for those betting on a V-shaped recovery.


A look at Building Permits:
We have to keep close tabs on building permits because they are the precursor to housing starts.  Although the issuance of a housing permit does not necessarily result in new construction, as you can see the two series do move together over time. 
For other reactions to the housing start data.

Producer Price Index (PPI) and Crude Nonfood Materials Less Energy

The Producer Price Index measures changes in prices that manufacturers and wholesalers pay for goods during various stages of production.  There are three important sub-groups that measure price changes at each stage in production: crude goods, intermediate goods, and finished goods.  We like to look at all three stages because a price increase (or decrease) can be seen further down the stage in production and will ultimately be passed on to the consumer.  Early signs of inflation that show up in the PPI eventually make there way (6 to 9 months) into the CPI.

The PPI for Finished Goods in May edged down 0.3 percent.   
(Table 1. Producer price indexes and percent changes by stage of processing)

If we skip straight to crude nonfood materials less energy (very bottom of the table) we see a (not seasonally adjusted) 40.8% increase in prices since May 2009.  Generally prices for this group have proven to be very sensitive to economic turning points.  As an economy gears up production, commodities (timber, demand for metal, ect.) tend to increase in price very early in the expansion process.  The opposite occurs when the economy contracts and we see commodity prices fall months before an economy enters recession as purchases slow and unsold inventories accumulate.

Tuesday, June 15, 2010

A Look at Housing and The Case for The Double-Dip

Why look at housing to gauge whether the U.S. is in a fragile state?  Except for one instance, there has never been a recession at a time when the housing sector was strong.  The following graph tells the tale of housing starts (you can see that in 2001 the housing market was strong and the recession was brief) and recessions:
As you can see, residential real estate is among the first sectors to shut down when the economy approaches recession and one of the earliest to take off when the economy starts to turn around. The small spike in housing starts can be explained by the home buyers tax credit which expired as of April 30th.  Now the standard explanation for all this suggests that when mortgage rates fall and housing prices decline interest in home buying is rekindled now that it is more affordable.  Builders in turn rush back to banks before the cost of borrowing goes up again. 
A look at the 30-year conventional mortgage suggests that rates are at an all time low:

But borrowing is hard to do with commercial banks decreasing the amount of real estate loans that are
on their balance sheets (in the 2001 recession banks kept increasing the amount of real estate loans):
This is understandable with the ratio of nonperforming loans going up:
And the resulting "flight to quality" as commercial banks increase their purchase of U.S. Treasuries:

These graphs make the case for the double dip because without any demand for and supply of housing loans we are going to see a very fragile and painful recovery. 

Today's Housing Market Index (HMI): An Ominous Precursor to Tomorrow's Housing Starts

Today we are looking at the National Association of Home Builders/Wells Fargo Housing Market Index.  This index is of interest because of its timeliness (released the same month it reports on) and ability to foreshadow other important housing indicators (like the Census Bureau's next day release of housings starts).  It also has a proven track record of being a decent leading indicator of future home sales.  How does one go about interpreting this index? Any index number above 50 is interpreted as "there are more builders who view conditions as good than there are builders who view conditions as poor." Any number below 50 and we have more builders viewing conditions as poor than those who see conditions as good.

There are three main components to the Housing Market Index (HMI):
 ( Table 3. NAHB/Wells Fargo National HMI Components History)

1) Single-Family Sales: Present
This section usually does a better job of predicting housing starts in the short term (next couple months) than the official HMI.  This index number is back down to 17 in June after hitting 23 in May, this verifies that the housing industry is still getting pounded.  This also reflects that the small glimmer of hope that the home buyer tax credit brought is now gone.

2) Single-Family Sales: Next 6 Months
This reflects future expectations of single-family home sales over the next 6 months given current assumptions on economic growth and interest rates.  The next six months looks bleak as well as we see a downward movement in the index from 27 in May to 23 in June.  

3) Traffic of Prospective Buyers
This number gauges the number of buyers walking onto new home sites. With this index reading of 14 housing conditions will be mute for sometime to come.

By looking at today's HMI we can get a feel for what the Census Bureau's housing starts will look like.
The Census Bureau will release housing start data tomorrow at 8:30 a.m.  The feeling I get (based off of todays HMI) is that the housing start numbers will be really weak.

Empire State Manufacturing Survey for June: Slightly Better?

Each month the Federal Reserve Bank of New York releases the Empire State Manufacturing Survey (ESMS) which tracks manufacturing activity in New York.  Although this particular survey does not necessarily shake markets up, the nice people at the Federal Reserve like to look at the ESMS because it provides hints on the forthcoming (and highly influential) Institute for Supply Management (ISM) Manufacturing Index (for a quick refresher).  It is designed to gauge the present condition of New York's manufacturing industries, as well as what company execs believe they will do in the next six months.
Positive index number indicates that more respondents believe that the index will move higher than lower.  A negative index number tells us that more respondents were expecting that variable to decrease than increase.

Things to notice when looking at the Empire State Manufacturing Survey:

1. General Business Conditions Index- where a positive index number is a sign that factory activity is strengthening. This index edged up slightly from 19.11 in May to 19.57 in June. 

2. New Orders Diffusion Index- where a jump in new orders is a good sign that factories will keep on producing.  We see a nice increase in new orders with the index rising from 14.3 in May to 17.53 in June. 

3. Unfilled Orders- which measures how overburdened (or under burdened) manufacturers are.  The larger the index number the more businesses may want to spend to expand production capacity to satisfy customers with snappier deliveries.  We have seen a nice improvement here as this index went from -7.89 in May to -1.23 in June.

4. Prices Paid- because the first signs of inflation appears here as factories ultimately pass higher costs onto consumers.  Keep in mind that the Fed monitors this section closely (price stability is part of the Federal Reserve's dual mandate).  Inflation does not seem to be as eminent on the horizon as it was last month but input prices are still expected to increase as this index moved from 44.74 in May to 27.16  in June.

5. Prices Received- as these help to forecast changes in corporate earnings. There is little change here as the index moved slightly downward from 5.26 to 4.94. 

6. Number of Employees- which is the earliest indicator available on labor conditions for the month.  This is where you preview changes in manufacturing jobs that could be seen in the official employment situation report.  Unfortunately we don't see the enthusiasm we saw last month in this indicator as it contracted from 22.37 in May to 12.38 in June.  This means that more firms this month than last month will be looking at lowering their number of employees and reducing their search for new hires.

From the NY Fed:
"The Empire State Manufacturing Survey indicates that conditions for New York manufacturers improved in June. The general business conditions index edged up from its May level to 19.6, extending its string of positive readings to eleven months. The new orders and shipments indexes were also positive and higher than their May levels. The inventories index remained near zero for a second straight month, indicating that inventory levels were little changed."

Monday, June 14, 2010

You know what's not going to occur this June 23rd?

An increase in the Federal Funds rate by the Federal Open Market Committee (FOMC).

Follow around the Federal Reserve's Board of Governors and you get a sense that the Fed is making it blatently clear.  From Chairman Bernanke's testimony to Congress:
"The latest economic projections of Federal Reserve Governors and Reserve Bank presidents, which were made near the end of April, anticipate that real gross domestic product (GDP) will grow in the neighborhood of 3-1/2 percent over the course of 2010 as a whole and at a somewhat faster pace next year.  This pace of growth, were it to be realized, would probably be associated with only a slow reduction in the unemployment rate over time. In this environment, inflation is likely to remain subdued. "
To begin with let us think about what the Fed is mandated by law to do (for a wonderful speech by Frederic S. Mishkin on this):
"to promote effectively the goals of maximum employment, stable prices, and moderate long-term interest rates"
This being said with the employment numbers so weak (with initial claims for unemployment insurance still around 456,000) and inflation not even poking its nasty head up to say hello, there is no way (by law) that the Federal Reserve will raise the Federal Funds rate.  With long-term inflation expectations stable and a struggling labor market why in the world would the Fed raise the interest rate?

Maybe, some should argue, that the zero bound interest rate will cause global imbalances elsewhere as investors search for the greatest yield.  This may lead to a rush of credit to fuel the next great bubble.  This leads me down the road to a third possible mandate: Financial Stability.  Financial stability is one thing, maximum employment and stable prices are certainly another.  The traditional monetary policy interest rate policy is way too blunt to deal with asset price bubbles and other threats to our economy.  So to deal with this problem, lets create a new mandate for the Fed.  Clearly I am not the first person to reach this conclusion- having first read something about this back in November of 2009:
"When it comes to redesigning monetary policy, there is disagreement as to how this might best be accomplished. Wharton finance and economics professor Franklin Allen believes more checks and balances could be built into the Federal Reserve system. “We need to have a third mandate - - a financial stability mandate,” he said."
An adaptive financial stability mandate would give the Fed power to monitor developments in the financial world and allow it to 'quickly' propose regulation to make the growth more balanced.  I know this sounds a little far fetched but why not?  If mortgage origination was such a rampant free for all, then why not have the Fed be alerted of the developments?  The Fed could theoretically be allowed to step in to find gaps in the regulation and the private sector could help:
 "A dynamic regulatory regime is most likely to be realized if it receives non-governmental perspectives on these changes. In addition to disclosing more data to investors and counterparties, exposing supervisory practices and policies to external assessment in a structured way can improve supervision. Such exposure could, for example, reduce the chances of regulators converging around a conventional wisdom that overlooks anomalous data."
If the Fed is allowed to extend credit to failing firms then it should be allowed to adaptively regulate those same firms.  For more on financial regulation, Daniel K.Tarullo of the Federal Reserves seems to be on the front lines.

Your Summer Reading List

Want to stay well read and relevant? Read the following two books.

1. The Squam Lake Report: Fixing the Financial System
Regulation is currently and will continue to be a highly debated topic in economics.  Why not embrace this and learn about the leading recommendations for regulatory reform?

2. Animal Spirits: How Human Psychology Drives the Economy and Why It Matters for Global Capitalism
Believe it or not economics involves human actors and the bottom line is that psychology does a reasonably good job of explaining the behavior of those actors.  Behavioral Economics is an exciting new field that should be embraced by anyone who wants to gain a deeper insight into the rationality or irrationality of the economy.

Sunday, June 13, 2010

The Inventory to Sales Ratio and the Business Cycle

What is the Inventory-to-Sales Ratio and what can it tell us about where we are in the business cycle?  The inventory/sales ratio is put out every month in a report called the Manufacturing and Trade Inventories and Sales report by the United States Census Bureau and reflects the demand for goods by showing how sales are moving in relation to inventories.  Increasing sales relative to inventories is a positive sign because it means businesses are being outstripped by current demand.  A declining inventory/sales ratio is usually good news for the economy since it means that sales are increasing faster than inventories. Businesses respond to meet the increase in sales by speeding up orders and production rates. Therefore, a downturn in the inventory/sales ratio is a leading indicator that business conditions are improving and that interest rates are reaching cyclical troughs.

A rising inventory/sales ratio means that inventories are rising faster than sales.  In this scenario, businesses become overstocked and they respond to this unintended buildup of inventories by postponing orders and cutting production rates.  An upturn in the inventory/sales ratio is a leading indicator that business conditions are deteriorating and that short-term interest rates are approaching a cyclical peak.

So what are we seeing right now? Well the inventory/sales ratio has been decreasing which indicates that business conditions are indeed improving, but the inventory adjustment process may be over.  We are not going to see this contribution to GDP be as prolific as it has been in the recent past.  This has been highlighted by the blog Calculated Risk:
"It now appears the inventory adjustment is over.  Further growth in inventories will depend on increases in underlying demand."
The April report reveals that the ratio is 1.23 which means that it would take 1.23 months to completely clear inventories at the current level of sales.