What does an increase in counterparty risk even mean? It means that banks become more reluctant to lend to other banks because of the perception that the risk of default on their loans has increased and/or the market price of taking on such risk has risen. The following three measures are said to reflect the current amount of counterparty risk.
Libor-Ois spread:
Overnight index swap (OIS) is composed As follows: at maturity, the parties exchange the difference between the interest that would be accrued from repeatedly rolling over an investment in the overnight market and the interest that would be accrued at the agreed OIS fixed rate. In contrast to Libor loans, OIS transactions involve little counterparty risk as no money changes hands until the maturity date. The difference in these two spreads is said to reflect counterparty risk and not liquidity factors.
Credit Default Swaps:
One measure of counterparty risk is the probability that banks might default on their debt. These probabilities can be assessed using the premiums on credit default swaps (CDS) which are like insurance policies for corporate bonds. the purchaser of a CDS pays a periodic fee to the seller in exchange for the promise of a payment, in the event of a bankruptcy or a default, of the difference between the par value and the market value of the corporate bond.
Libor-Repo spread:
This is the interest rate spread between unsecured and secured lending. The greater the risk of nonpayment of the loan the higher the spread should be. Repurchase Agreements(Repos) between banks are backed by Treasury Securities and are a form of secured lending.
Saturday, August 21, 2010
Monday, August 16, 2010
Everything But My Tuition Keeps Falling
A glance at the Empire State Manufacturing Survey reveals falling prices as the prices paid index shows disinflation and the prices received index hints at deflation:

The drop off in prices at the early production stages suggests that inflation will be lower down the line. A look at the Producer Price Index later this week, under the category "crude nonfood materials less energy" should reveal any deflationary cost pressures.
"Both price indexes declined. Continuing its downward trend for a third consecutive month, the prices paid index fell 5 points to 20.0, suggesting that the pace of input price increases slowed. The prices received index, at -2.9, remained negative for a second consecutive month, a sign that selling prices were slightly lower in August."Additionally, the ISM manufacturing prices index is indicating a drop off in the rate of price increases:

The drop off in prices at the early production stages suggests that inflation will be lower down the line. A look at the Producer Price Index later this week, under the category "crude nonfood materials less energy" should reveal any deflationary cost pressures.
Sunday, August 15, 2010
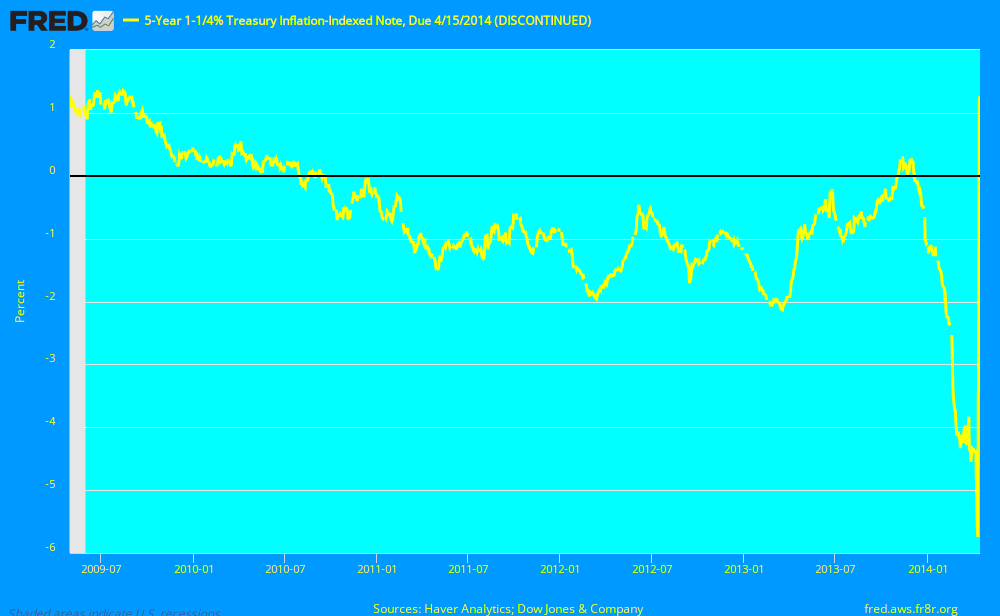
A Look At TIPS Inflation Expectations
Here is the expected inflation. As stated before, (5 year nominal interest rate treasuries - 5 year TIPS) = expected inflation for next five years.

A look at the 5 year TIPS itself:

Is there possible deflation on the horizon?

A look at the 5 year TIPS itself:
Is there possible deflation on the horizon?
Friday, August 13, 2010
David Rosenberg: Odds of Double-Dip Greater Than 50/50
Real time economics highlights an interview with David Rosenberg, Chief Economist at Canadian firm, Gluskin, Sheff & Associates:
Wednesday, August 11, 2010
Time to hold your breath
First of all closely watch this Friday's CPI (Consumer Price Index) index release, then closely follow other price index releases like the producer price index on the 17th. If the CPI trends to anything more "normal" then expected prepare to see a spike in U.S. treasury yields and a boom in stock prices. If the CPI stays the same or trends downward then bond yields will go lower as deflation would make the return on bonds -depending on how bad deflation got- attractive. In that case expect to see a significant decline in equities. The element that's hard to account for, the human element, will play a huge role. If investors get tired of the low treasury yields or if some happen to run hedge funds that promise wonderful returns, then there will be a greater incentive to take risks, and bond yields spike and the stock market rally.
Furthermore, depressing news from Europe like the recession in Greece worsening, any more bank failures and bailouts (Goldman Sachs perhaps?), and last but not least the Federal Government bailing out states that can't fulfill their debt obligations could also lead to treasury yields going lower. As one can see we are certainly in some rocky waters.
Furthermore, depressing news from Europe like the recession in Greece worsening, any more bank failures and bailouts (Goldman Sachs perhaps?), and last but not least the Federal Government bailing out states that can't fulfill their debt obligations could also lead to treasury yields going lower. As one can see we are certainly in some rocky waters.
Fed Challenge: A look at the competition and the experience
What the Chicago Fed does:
http://vimeo.com/8208920
Fed Challenge:
http://vimeo.com/5580423
Northwestern has won the Chicago Fed Challenge the past six years! The streak ends here if I have anything to say about it. A look at the competition:
http://www.northwestern.edu/newscenter/stories/2009/11/fed.html
Here is some basic information:
http://www.richmondfed.org/education/for_teachers/academic_competitions/college_fed_challenge/participants_resources/pdf/handbook.pdf
Imports, Exports and the Trade Balance
Rising imports are a sign that U.S. Consumers and Business are in fact demanding more. From the BEA report:
"June imports were $5.9 billion more than May imports of $194.4 billion."
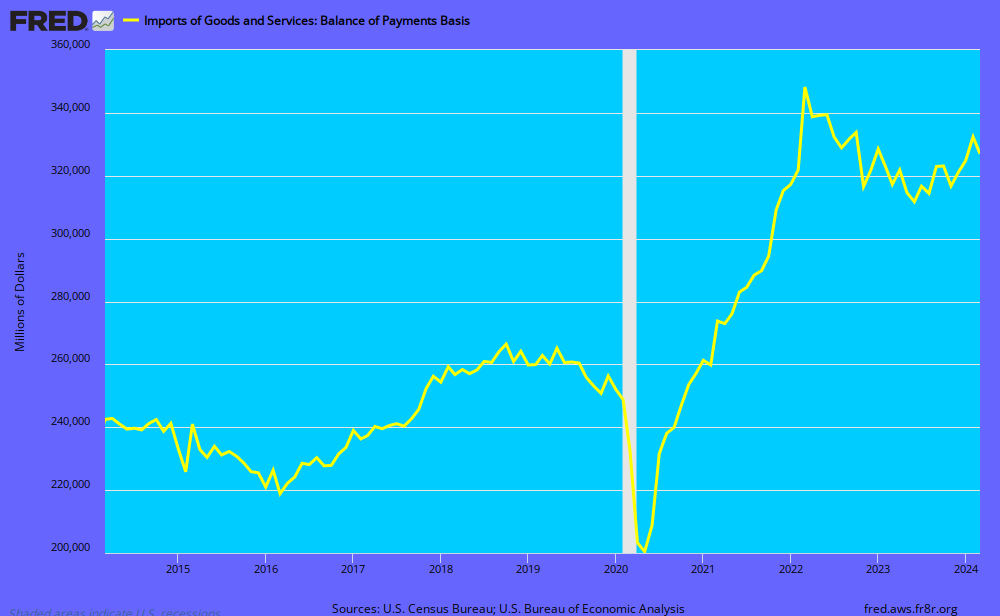
Meanwhile, U.S. Exports are also increasing but a slightly decreasing rate. The BEA stated today that:
"June exports were $2.0 billion less than May exports of $152.4 billion."From the graph it appears that global demand for U.S. goods and services has been turning up as well:
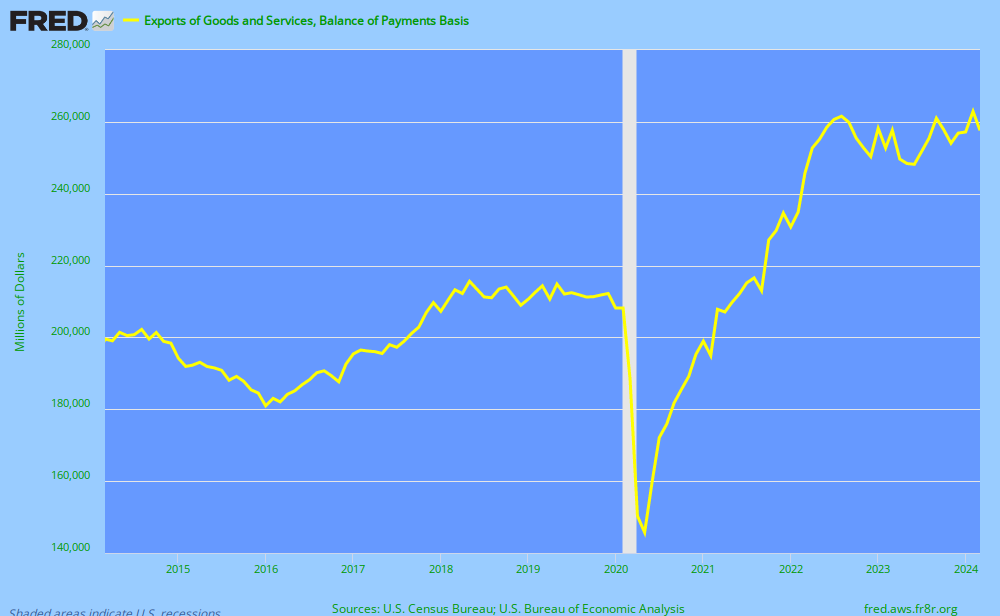
From the previous two graphs we get to look at a deteriorating trade balance (exports - imports):

Tuesday, August 10, 2010
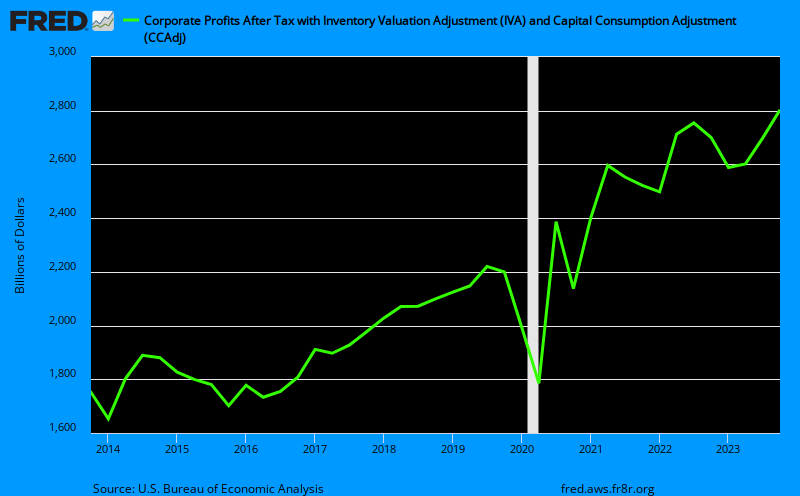
From Private to Public: A Transfer of Debt
Corporate profits go up in recessions as mass layoffs lower operating costs and reduce corporate debt levels. Furthermore, the government takes the hit through unemployment insurance benefits, bailouts and lower income and sales tax receipts.
Corporate profits are going up, this is the result of massive layoffs and cutbacks, which also has raised workers productivity levels:

Debt levels are falling as more people are defaulting and are finding themselves in the 1-in-4 poor FICO credit score of 600 or less:

The financial obligations (total consumer and auto loans plus total consumer debt and mortgage debt) as a percent of disposable personal income (or income after taxes) has shown a semi-significant decline:

Were is all this debt being transfered to? The Federal Governments balance sheet: unemployment insurance claims first skyrocketing and now remaining steady:

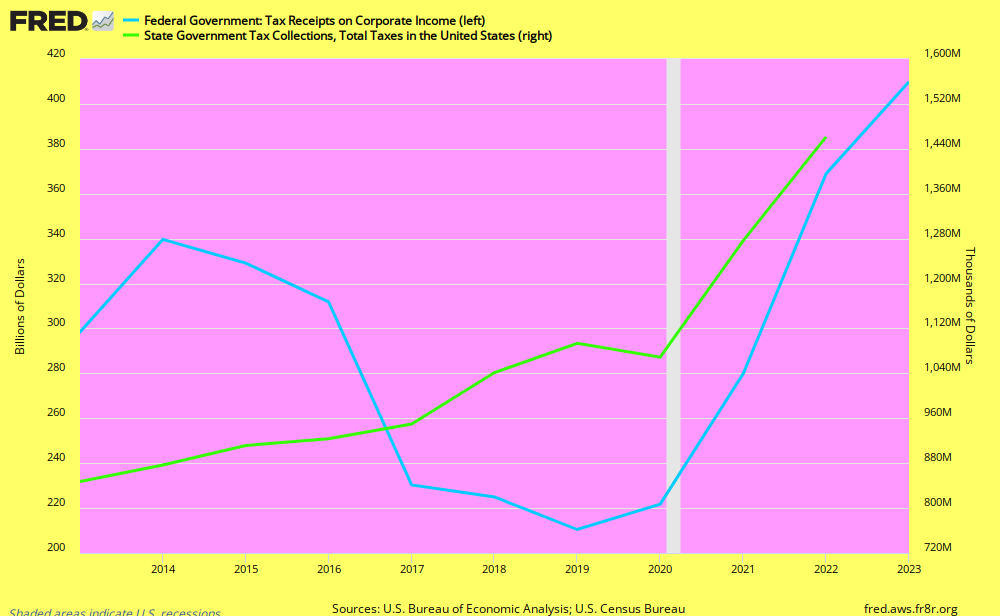
Government bailouts also lowered private debt levels and the biggest hit comes from decreased revenue from federal taxes on corporate profits and state income taxes:

But it all adds up to a skyrocketing increase in the public debt:

There has been an effective transfer from the private sector to the public sector.
Corporate profits are going up, this is the result of massive layoffs and cutbacks, which also has raised workers productivity levels:
Debt levels are falling as more people are defaulting and are finding themselves in the 1-in-4 poor FICO credit score of 600 or less:

The financial obligations (total consumer and auto loans plus total consumer debt and mortgage debt) as a percent of disposable personal income (or income after taxes) has shown a semi-significant decline:

Were is all this debt being transfered to? The Federal Governments balance sheet: unemployment insurance claims first skyrocketing and now remaining steady:

Government bailouts also lowered private debt levels and the biggest hit comes from decreased revenue from federal taxes on corporate profits and state income taxes:
But it all adds up to a skyrocketing increase in the public debt:
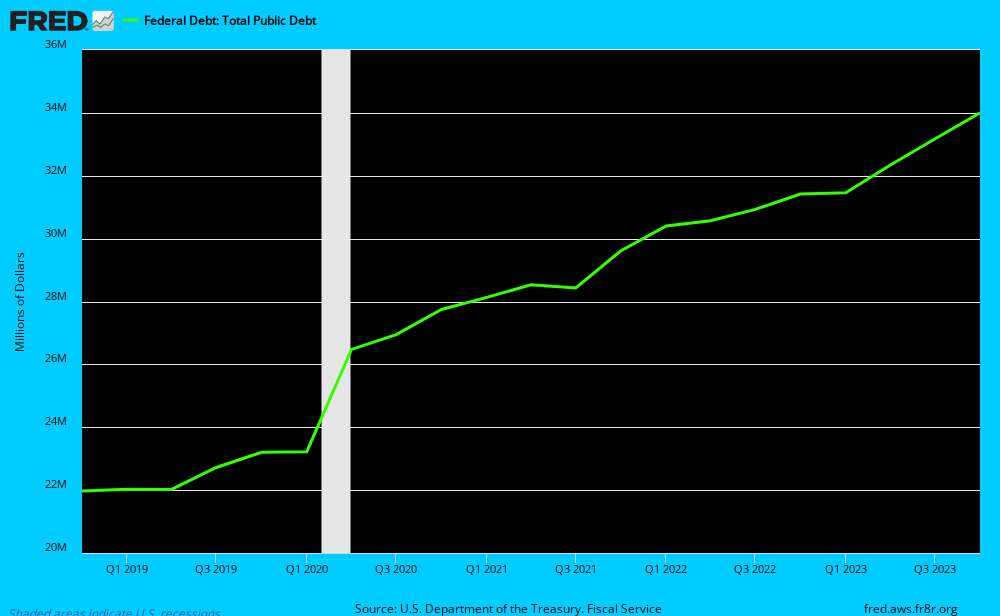
There has been an effective transfer from the private sector to the public sector.
Friday, August 6, 2010
Income Effect May Initially Knock Consumer Spending Down But Credit Constraints Will Keep Spending Down
The WSJ Real Time Economics blog highlights one economist's view that the income effect - not the debt burden - is the main reason for depressed consumer spending. It is nice to know that people haven't significantly increased their debt service payments to income, so the burden may not be that much greater on existing debt. But think about the constrained credit markets as getting new debt or credit is a different burden with the same effect. This fact cannot be denied- it is harder to get credit especially if you are the one in four with a credit score of 600 or less. So it is the supply side that is constraining the credit. This is evidenced through credit cards limits being significantly lower and a much greater proportion of credit card applicants who have been denied credit. As more Americans are laid off, defaults increase as some are forced to renege on a mortgage they can no longer handle (because their income is gone or cut in half with state unemployment insurance benefits) and their credit score is significantly impacted so they are not considered credit worthy (600 or less FICO credit score). People with significantly less income and having recently defaulted are not able to get credit to buy stuff and this impacts spending and aggregate demand. So more people are getting laid off as unemployment insurance claims hit a 4 month high at 479,000 this week. The unemployed (who now receive half or less income ) can't spend like they did when they had an income stream. In fact they can't spend almost half (subtract for savings) of what they used to spend. Almost one half of their normal consumption level is the new norm for them.
Where can they go if they want to maintain or at least semi-resemble the lives they had before they lost their jobs? They have to borrow the rest. Unfortunately for them (and us) they are unable to borrow because they are less credit worthy (having no suitable income stream) so no one will extend credit to these risky borrowers. So it is the not only the income effect but the credit effect. Think about it this way- the standard of living and life style of most people (most people don't save very much) is maintained with a cash flow that comes from either borrowing or a job. Well when both of those things are suddenly constrained where is the needed cash flow supposed to come from? Bottom Line: Don't expect consumer spending to pick up anytime soon and don't expect unemployment to fall anytime soon either. These two things are related as 70% of our economy is based on the consumption of services. The Employment Situation came out today to reveal what we already know- unemployment is not budging and has held firm at 9.5% the past two months.
Where can they go if they want to maintain or at least semi-resemble the lives they had before they lost their jobs? They have to borrow the rest. Unfortunately for them (and us) they are unable to borrow because they are less credit worthy (having no suitable income stream) so no one will extend credit to these risky borrowers. So it is the not only the income effect but the credit effect. Think about it this way- the standard of living and life style of most people (most people don't save very much) is maintained with a cash flow that comes from either borrowing or a job. Well when both of those things are suddenly constrained where is the needed cash flow supposed to come from? Bottom Line: Don't expect consumer spending to pick up anytime soon and don't expect unemployment to fall anytime soon either. These two things are related as 70% of our economy is based on the consumption of services. The Employment Situation came out today to reveal what we already know- unemployment is not budging and has held firm at 9.5% the past two months.
Tuesday, August 3, 2010
What Is So Terrible About Deflation?
The Federal Reserve and most other major central banks of industrialized nations follow a price stability mandate or goal. Usually the goal is around 2% annual inflation and anything lower is discouraged. Price stability is not quantified as inflation at zero or even near zero (0% - 1%). In the following discussion we assume that the Fed has been pursuing a zero inflation target (even though they are currently clearly trying to avoid deflation) as that is most clearly where we (the United States) currently are. The following problems are brought up with such low realized level of inflation (from Mishkin's Monetary Policy Strategy, pg. 359):
"One reason relates to downward nominal wage rigidity. If the inflation rate were to approach zero under the condition of downward wage rigidity, it would be difficult to achieve real wage adjustment in response to changed market conditions, such as a negative demand shock. The result would be higher-than-desirable real wages, higher unemployment, and lower economic growth"In layman's terms: If prices fall and wages are resistant to falling with them, then real wages have gone up and more workers are going to get whacked.
"A second reason relates to the impossibility of reducing nominal interest rates below zero, which means that if inflation is close to zero, real interest rates cannot be pushed below zero when this might be necessary to in order to stimulate economic activity"A third issue with such a low level of realized inflation, which let me repeat myself by saying would be equal in our case with a hypothetical zero inflation target by the Fed, is that:
"A zero inflation target may lead to periods of deflation, which could promote financial instability and make it harder to conduct monetary policy because interest rates no longer provide a useful guide to the stance of monetary policy"Deflation is also a key factor promoting episodes of financial instability in industrialized nations because debt contracts in industrialized nations frequently have long maturities. This means that a deflation leads to an increase in the real indebtedness of both households and firms, which in turn leads to a decline in their net worth and a deterioration of their balance sheets. Taking the "credit view" with decreased net worth, adverse selection (defined as the problem created by asymmetric information before a transaction occurs: The people who are the most undesirable from the other party's point of view are the ones who are most likely to want to engage in a financial transaction) and moral hazard (the risk that one party to a transaction will engage in behavior that in undesirable from the other party's point of view) problems increase for lenders, who therefore cutback on lending. Mishkin describes the following outcome:
"The decline in net worth also leads to a decline in the amount of collateral a lender can grab if the borrowers investments turn sour, and the reduction in collateral therefore increases the consequences of adverse selection, because loan losses resulting from default are likely to be more severe. In addition, the decline in net worth increases moral hazard incentives for borrowers to take excessive risks because now they have less to lose if their investments fail."Apparently Paul Krugman wrote about this as well.
Sunday, August 1, 2010
GDP Numbers: Actually Not That Bad
Gross Domestic Product (GDP), measures how fast or slow the economy is growing. GDP reflects the final value of all output regardless of whether it was sold or placed in inventory. The current report reveals that Real GDP (GDP adjusted for inflation) is slowing down from 3.7% growth in the last quarter to only 2.4% in the second quarter. One thing to keep in mind is that this is the advance estimate so it is based on source data that are incomplete or subject to revision. Lets just hope the revision isn't downward as 2.4% is already severely below most economists expectations.
Things included in the report:
Imports of goods are up 35.4% which is a sign that Americans are spending more (although this did put a damper on the GDP number).
Durable Goods only grew 7.5%- although this is not surprising given the severe cutback in the availability of consumer credit. Also one in four Americans has a credit rating of less than 600 which essentially prevents them from getting any credit for at least a while to come.
Gross Private Domestic Investment- what businesses invest in plants plants and equipment (this number grew 28.8% which is healthy). This series tends to be ridiculously volatile but we'll look at it anyway. Most of the increase has stemmed from nonresidential investment in equipment and software which saw a 21.9% increase and a surprising increase in residential investment of 27.9%. Residential investment includes single family homes and apartment buildings.
Also the government came to the rescue somewhat with non-defense government consumption expenditures seeing a 13% increase. This means that things are indeed getting built and that the government is responsible for putting some people to work.
This recession has been characterized by some (including Christina Romer doing a recent interview with the WSJ) as a problem of deficient aggregate demand.
To get a better measure of pure demand within the U.S. economy look at gross domestic purchases under "Addenda". This measure sums up total purchases by U.S. consumers and businesses regardless of whether the product was actually made in the U.S. or somewhere else. This measure excludes exports and includes imports. This measure is up 5.1% which is the largest increase in several years and definitely a positive sign. Also an even better measure is final sales to domestic purchasers which was up 4.1%. This measure excludes changes in inventories and exports to foreigners making this possibly the purest measure of demand. So what have we learned? While the official measure of GDP is increasing at a decreasing rate the actual demand for goods by Americans has in fact been increasing at an increasing rate. This is certainly better news than what most economist have you believe. Furthermore, if final sales are increasing at a faster rate than GDP growth it is a sign of strong economic growth ahead as companies accelerate production to meet higher demand.
Now for a look at deflationary risks:
Go to table 4 in the report. Near the bottom of table 4 under implicit price deflator lies the deflator for gross domestic purchases. Same as before this measure takes into account price changes from all purchases (including imports) and only saw an increase of 0.1%. This is some scary disinflation that may soon turn negative to reveal deflation.
Another thing to look at is the Personal Consumption Expenditures deflator (or PCE deflator). The Fed uses this measure and relies on it more than CPI because it is sensitive to ongoing changes in consumer spending patterns. This measure is certainly showing disinflation 2.9% -> 2.7% -> 2.1% -> 0.1% and reveals that deflation is around the corner.
Subscribe to:
Posts (Atom)