Last Wednesday we met and if you missed it we watched some general videos from the Richmond Fed.
Make sure to click on Fed Challenge workshop:
http://www.richmondfed.org/education/for_teachers/academic_competitions/college_fed_challenge/participants_resources/index.cfm
We also discussed the Institute of Supply Management's Purchasing Managers Index. The ISM is the first thing to come out at the beginning of each month and the fed watches this indicator very closely. They pay particularly close attention to the sections of the ISM which cover Prices, Employment and of course the overall PMI. If you have questions please let me know!
On Monday we will be going over the following:
1). What Initial Claims for Unemployment means and why the fed looks at it
2). In depth analysis of today's release of the Employment Situation (still 9.6% unemployment, we will discuss why this is NOT a surprise)
Friday, September 3, 2010
Saturday, August 21, 2010
Three Measures of Counterparty Risk
What does an increase in counterparty risk even mean? It means that banks become more reluctant to lend to other banks because of the perception that the risk of default on their loans has increased and/or the market price of taking on such risk has risen. The following three measures are said to reflect the current amount of counterparty risk.
Libor-Ois spread:
Overnight index swap (OIS) is composed As follows: at maturity, the parties exchange the difference between the interest that would be accrued from repeatedly rolling over an investment in the overnight market and the interest that would be accrued at the agreed OIS fixed rate. In contrast to Libor loans, OIS transactions involve little counterparty risk as no money changes hands until the maturity date. The difference in these two spreads is said to reflect counterparty risk and not liquidity factors.
Credit Default Swaps:
One measure of counterparty risk is the probability that banks might default on their debt. These probabilities can be assessed using the premiums on credit default swaps (CDS) which are like insurance policies for corporate bonds. the purchaser of a CDS pays a periodic fee to the seller in exchange for the promise of a payment, in the event of a bankruptcy or a default, of the difference between the par value and the market value of the corporate bond.
Libor-Repo spread:
This is the interest rate spread between unsecured and secured lending. The greater the risk of nonpayment of the loan the higher the spread should be. Repurchase Agreements(Repos) between banks are backed by Treasury Securities and are a form of secured lending.
Monday, August 16, 2010
Everything But My Tuition Keeps Falling
A glance at the Empire State Manufacturing Survey reveals falling prices as the prices paid index shows disinflation and the prices received index hints at deflation:

The drop off in prices at the early production stages suggests that inflation will be lower down the line. A look at the Producer Price Index later this week, under the category "crude nonfood materials less energy" should reveal any deflationary cost pressures.
"Both price indexes declined. Continuing its downward trend for a third consecutive month, the prices paid index fell 5 points to 20.0, suggesting that the pace of input price increases slowed. The prices received index, at -2.9, remained negative for a second consecutive month, a sign that selling prices were slightly lower in August."Additionally, the ISM manufacturing prices index is indicating a drop off in the rate of price increases:

The drop off in prices at the early production stages suggests that inflation will be lower down the line. A look at the Producer Price Index later this week, under the category "crude nonfood materials less energy" should reveal any deflationary cost pressures.
Sunday, August 15, 2010
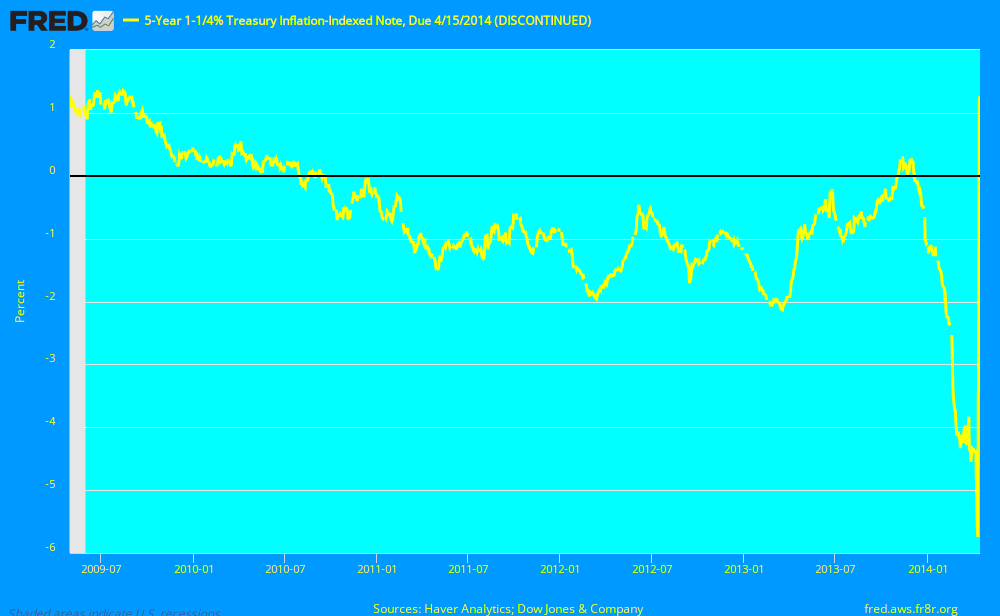
A Look At TIPS Inflation Expectations
Here is the expected inflation. As stated before, (5 year nominal interest rate treasuries - 5 year TIPS) = expected inflation for next five years.

A look at the 5 year TIPS itself:

Is there possible deflation on the horizon?

A look at the 5 year TIPS itself:
Is there possible deflation on the horizon?
Friday, August 13, 2010
David Rosenberg: Odds of Double-Dip Greater Than 50/50
Real time economics highlights an interview with David Rosenberg, Chief Economist at Canadian firm, Gluskin, Sheff & Associates:
Wednesday, August 11, 2010
Time to hold your breath
First of all closely watch this Friday's CPI (Consumer Price Index) index release, then closely follow other price index releases like the producer price index on the 17th. If the CPI trends to anything more "normal" then expected prepare to see a spike in U.S. treasury yields and a boom in stock prices. If the CPI stays the same or trends downward then bond yields will go lower as deflation would make the return on bonds -depending on how bad deflation got- attractive. In that case expect to see a significant decline in equities. The element that's hard to account for, the human element, will play a huge role. If investors get tired of the low treasury yields or if some happen to run hedge funds that promise wonderful returns, then there will be a greater incentive to take risks, and bond yields spike and the stock market rally.
Furthermore, depressing news from Europe like the recession in Greece worsening, any more bank failures and bailouts (Goldman Sachs perhaps?), and last but not least the Federal Government bailing out states that can't fulfill their debt obligations could also lead to treasury yields going lower. As one can see we are certainly in some rocky waters.
Furthermore, depressing news from Europe like the recession in Greece worsening, any more bank failures and bailouts (Goldman Sachs perhaps?), and last but not least the Federal Government bailing out states that can't fulfill their debt obligations could also lead to treasury yields going lower. As one can see we are certainly in some rocky waters.
Fed Challenge: A look at the competition and the experience
What the Chicago Fed does:
http://vimeo.com/8208920
Fed Challenge:
http://vimeo.com/5580423
Northwestern has won the Chicago Fed Challenge the past six years! The streak ends here if I have anything to say about it. A look at the competition:
http://www.northwestern.edu/newscenter/stories/2009/11/fed.html
Here is some basic information:
http://www.richmondfed.org/education/for_teachers/academic_competitions/college_fed_challenge/participants_resources/pdf/handbook.pdf
Imports, Exports and the Trade Balance
Rising imports are a sign that U.S. Consumers and Business are in fact demanding more. From the BEA report:
"June imports were $5.9 billion more than May imports of $194.4 billion."
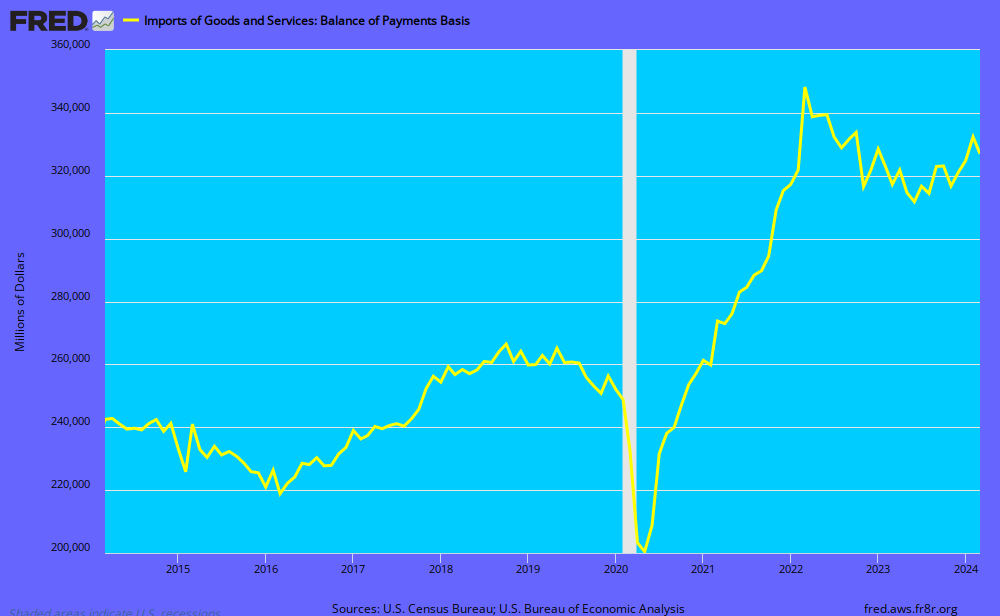
Meanwhile, U.S. Exports are also increasing but a slightly decreasing rate. The BEA stated today that:
"June exports were $2.0 billion less than May exports of $152.4 billion."From the graph it appears that global demand for U.S. goods and services has been turning up as well:
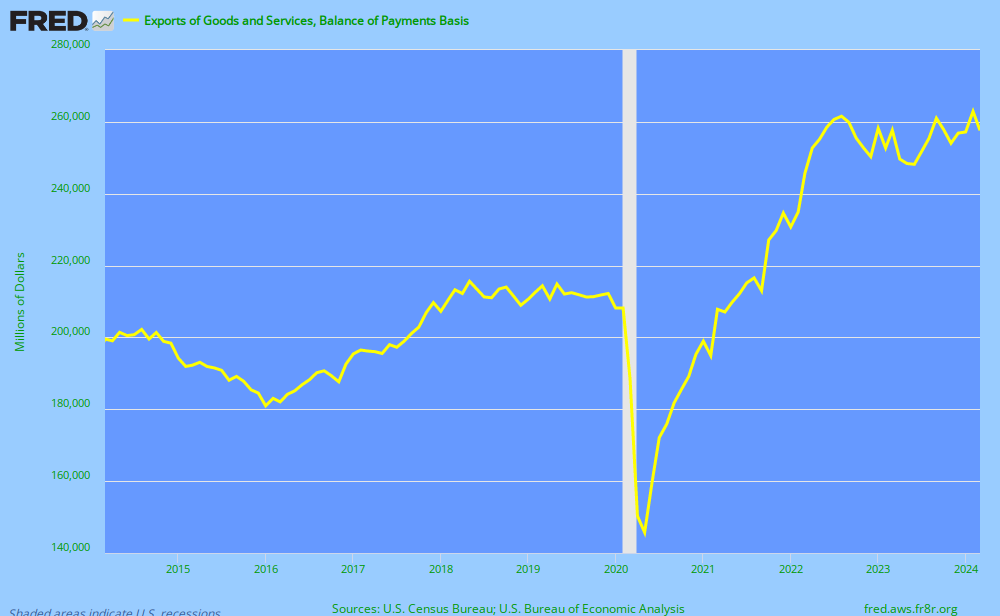
From the previous two graphs we get to look at a deteriorating trade balance (exports - imports):

Tuesday, August 10, 2010
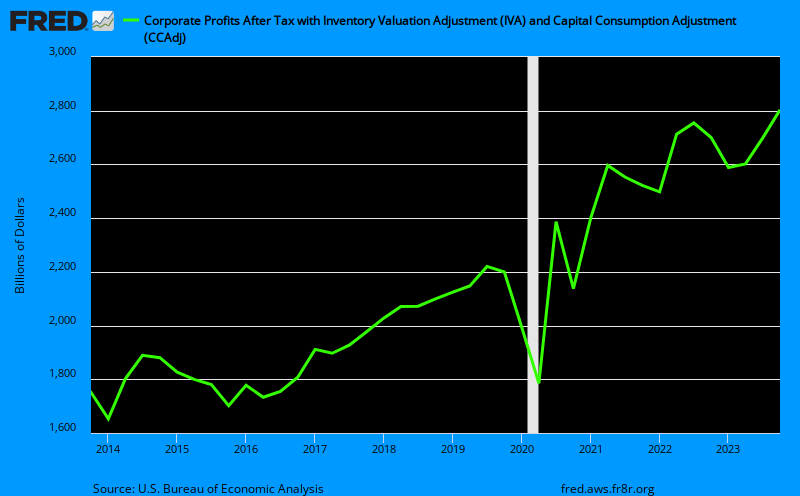
From Private to Public: A Transfer of Debt
Corporate profits go up in recessions as mass layoffs lower operating costs and reduce corporate debt levels. Furthermore, the government takes the hit through unemployment insurance benefits, bailouts and lower income and sales tax receipts.
Corporate profits are going up, this is the result of massive layoffs and cutbacks, which also has raised workers productivity levels:

Debt levels are falling as more people are defaulting and are finding themselves in the 1-in-4 poor FICO credit score of 600 or less:

The financial obligations (total consumer and auto loans plus total consumer debt and mortgage debt) as a percent of disposable personal income (or income after taxes) has shown a semi-significant decline:

Were is all this debt being transfered to? The Federal Governments balance sheet: unemployment insurance claims first skyrocketing and now remaining steady:

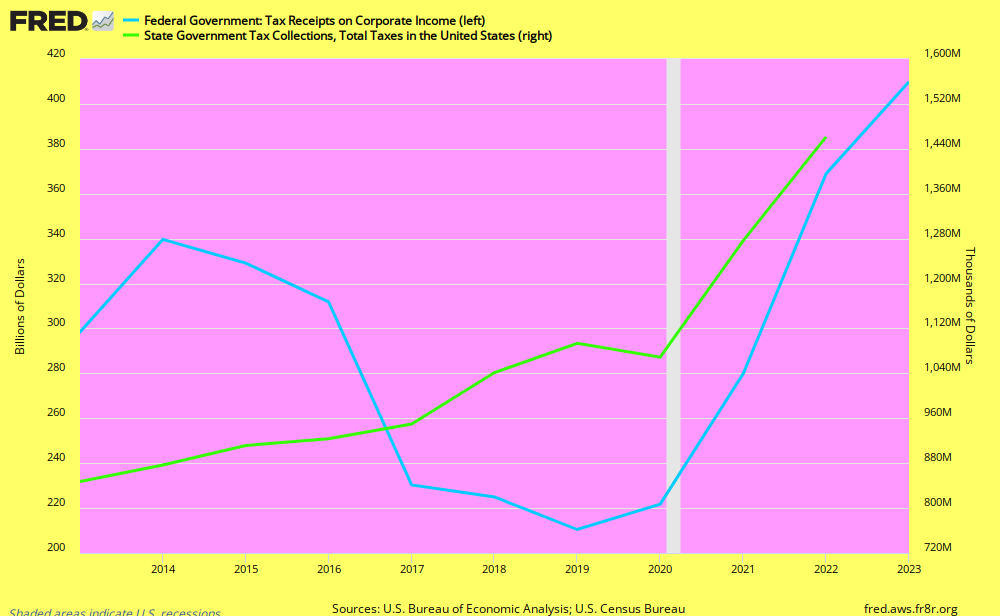
Government bailouts also lowered private debt levels and the biggest hit comes from decreased revenue from federal taxes on corporate profits and state income taxes:

But it all adds up to a skyrocketing increase in the public debt:

There has been an effective transfer from the private sector to the public sector.
Corporate profits are going up, this is the result of massive layoffs and cutbacks, which also has raised workers productivity levels:
Debt levels are falling as more people are defaulting and are finding themselves in the 1-in-4 poor FICO credit score of 600 or less:

The financial obligations (total consumer and auto loans plus total consumer debt and mortgage debt) as a percent of disposable personal income (or income after taxes) has shown a semi-significant decline:

Were is all this debt being transfered to? The Federal Governments balance sheet: unemployment insurance claims first skyrocketing and now remaining steady:

Government bailouts also lowered private debt levels and the biggest hit comes from decreased revenue from federal taxes on corporate profits and state income taxes:
But it all adds up to a skyrocketing increase in the public debt:
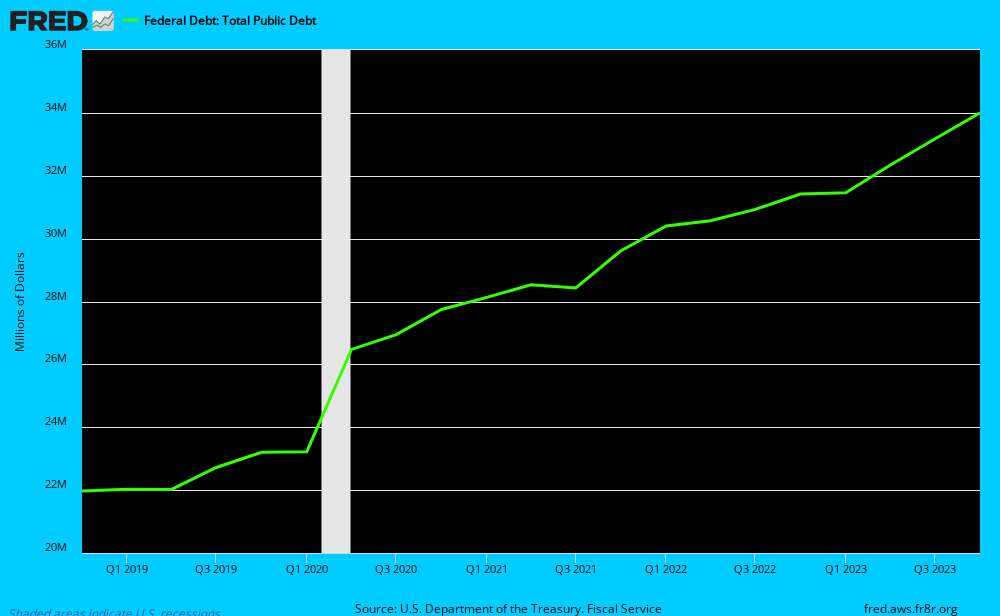
There has been an effective transfer from the private sector to the public sector.
Friday, August 6, 2010
Income Effect May Initially Knock Consumer Spending Down But Credit Constraints Will Keep Spending Down
The WSJ Real Time Economics blog highlights one economist's view that the income effect - not the debt burden - is the main reason for depressed consumer spending. It is nice to know that people haven't significantly increased their debt service payments to income, so the burden may not be that much greater on existing debt. But think about the constrained credit markets as getting new debt or credit is a different burden with the same effect. This fact cannot be denied- it is harder to get credit especially if you are the one in four with a credit score of 600 or less. So it is the supply side that is constraining the credit. This is evidenced through credit cards limits being significantly lower and a much greater proportion of credit card applicants who have been denied credit. As more Americans are laid off, defaults increase as some are forced to renege on a mortgage they can no longer handle (because their income is gone or cut in half with state unemployment insurance benefits) and their credit score is significantly impacted so they are not considered credit worthy (600 or less FICO credit score). People with significantly less income and having recently defaulted are not able to get credit to buy stuff and this impacts spending and aggregate demand. So more people are getting laid off as unemployment insurance claims hit a 4 month high at 479,000 this week. The unemployed (who now receive half or less income ) can't spend like they did when they had an income stream. In fact they can't spend almost half (subtract for savings) of what they used to spend. Almost one half of their normal consumption level is the new norm for them.
Where can they go if they want to maintain or at least semi-resemble the lives they had before they lost their jobs? They have to borrow the rest. Unfortunately for them (and us) they are unable to borrow because they are less credit worthy (having no suitable income stream) so no one will extend credit to these risky borrowers. So it is the not only the income effect but the credit effect. Think about it this way- the standard of living and life style of most people (most people don't save very much) is maintained with a cash flow that comes from either borrowing or a job. Well when both of those things are suddenly constrained where is the needed cash flow supposed to come from? Bottom Line: Don't expect consumer spending to pick up anytime soon and don't expect unemployment to fall anytime soon either. These two things are related as 70% of our economy is based on the consumption of services. The Employment Situation came out today to reveal what we already know- unemployment is not budging and has held firm at 9.5% the past two months.
Where can they go if they want to maintain or at least semi-resemble the lives they had before they lost their jobs? They have to borrow the rest. Unfortunately for them (and us) they are unable to borrow because they are less credit worthy (having no suitable income stream) so no one will extend credit to these risky borrowers. So it is the not only the income effect but the credit effect. Think about it this way- the standard of living and life style of most people (most people don't save very much) is maintained with a cash flow that comes from either borrowing or a job. Well when both of those things are suddenly constrained where is the needed cash flow supposed to come from? Bottom Line: Don't expect consumer spending to pick up anytime soon and don't expect unemployment to fall anytime soon either. These two things are related as 70% of our economy is based on the consumption of services. The Employment Situation came out today to reveal what we already know- unemployment is not budging and has held firm at 9.5% the past two months.
Tuesday, August 3, 2010
What Is So Terrible About Deflation?
The Federal Reserve and most other major central banks of industrialized nations follow a price stability mandate or goal. Usually the goal is around 2% annual inflation and anything lower is discouraged. Price stability is not quantified as inflation at zero or even near zero (0% - 1%). In the following discussion we assume that the Fed has been pursuing a zero inflation target (even though they are currently clearly trying to avoid deflation) as that is most clearly where we (the United States) currently are. The following problems are brought up with such low realized level of inflation (from Mishkin's Monetary Policy Strategy, pg. 359):
"One reason relates to downward nominal wage rigidity. If the inflation rate were to approach zero under the condition of downward wage rigidity, it would be difficult to achieve real wage adjustment in response to changed market conditions, such as a negative demand shock. The result would be higher-than-desirable real wages, higher unemployment, and lower economic growth"In layman's terms: If prices fall and wages are resistant to falling with them, then real wages have gone up and more workers are going to get whacked.
"A second reason relates to the impossibility of reducing nominal interest rates below zero, which means that if inflation is close to zero, real interest rates cannot be pushed below zero when this might be necessary to in order to stimulate economic activity"A third issue with such a low level of realized inflation, which let me repeat myself by saying would be equal in our case with a hypothetical zero inflation target by the Fed, is that:
"A zero inflation target may lead to periods of deflation, which could promote financial instability and make it harder to conduct monetary policy because interest rates no longer provide a useful guide to the stance of monetary policy"Deflation is also a key factor promoting episodes of financial instability in industrialized nations because debt contracts in industrialized nations frequently have long maturities. This means that a deflation leads to an increase in the real indebtedness of both households and firms, which in turn leads to a decline in their net worth and a deterioration of their balance sheets. Taking the "credit view" with decreased net worth, adverse selection (defined as the problem created by asymmetric information before a transaction occurs: The people who are the most undesirable from the other party's point of view are the ones who are most likely to want to engage in a financial transaction) and moral hazard (the risk that one party to a transaction will engage in behavior that in undesirable from the other party's point of view) problems increase for lenders, who therefore cutback on lending. Mishkin describes the following outcome:
"The decline in net worth also leads to a decline in the amount of collateral a lender can grab if the borrowers investments turn sour, and the reduction in collateral therefore increases the consequences of adverse selection, because loan losses resulting from default are likely to be more severe. In addition, the decline in net worth increases moral hazard incentives for borrowers to take excessive risks because now they have less to lose if their investments fail."Apparently Paul Krugman wrote about this as well.
Sunday, August 1, 2010
GDP Numbers: Actually Not That Bad
Gross Domestic Product (GDP), measures how fast or slow the economy is growing. GDP reflects the final value of all output regardless of whether it was sold or placed in inventory. The current report reveals that Real GDP (GDP adjusted for inflation) is slowing down from 3.7% growth in the last quarter to only 2.4% in the second quarter. One thing to keep in mind is that this is the advance estimate so it is based on source data that are incomplete or subject to revision. Lets just hope the revision isn't downward as 2.4% is already severely below most economists expectations.
Things included in the report:
Imports of goods are up 35.4% which is a sign that Americans are spending more (although this did put a damper on the GDP number).
Durable Goods only grew 7.5%- although this is not surprising given the severe cutback in the availability of consumer credit. Also one in four Americans has a credit rating of less than 600 which essentially prevents them from getting any credit for at least a while to come.
Gross Private Domestic Investment- what businesses invest in plants plants and equipment (this number grew 28.8% which is healthy). This series tends to be ridiculously volatile but we'll look at it anyway. Most of the increase has stemmed from nonresidential investment in equipment and software which saw a 21.9% increase and a surprising increase in residential investment of 27.9%. Residential investment includes single family homes and apartment buildings.
Also the government came to the rescue somewhat with non-defense government consumption expenditures seeing a 13% increase. This means that things are indeed getting built and that the government is responsible for putting some people to work.
This recession has been characterized by some (including Christina Romer doing a recent interview with the WSJ) as a problem of deficient aggregate demand.
To get a better measure of pure demand within the U.S. economy look at gross domestic purchases under "Addenda". This measure sums up total purchases by U.S. consumers and businesses regardless of whether the product was actually made in the U.S. or somewhere else. This measure excludes exports and includes imports. This measure is up 5.1% which is the largest increase in several years and definitely a positive sign. Also an even better measure is final sales to domestic purchasers which was up 4.1%. This measure excludes changes in inventories and exports to foreigners making this possibly the purest measure of demand. So what have we learned? While the official measure of GDP is increasing at a decreasing rate the actual demand for goods by Americans has in fact been increasing at an increasing rate. This is certainly better news than what most economist have you believe. Furthermore, if final sales are increasing at a faster rate than GDP growth it is a sign of strong economic growth ahead as companies accelerate production to meet higher demand.
Now for a look at deflationary risks:
Go to table 4 in the report. Near the bottom of table 4 under implicit price deflator lies the deflator for gross domestic purchases. Same as before this measure takes into account price changes from all purchases (including imports) and only saw an increase of 0.1%. This is some scary disinflation that may soon turn negative to reveal deflation.
Another thing to look at is the Personal Consumption Expenditures deflator (or PCE deflator). The Fed uses this measure and relies on it more than CPI because it is sensitive to ongoing changes in consumer spending patterns. This measure is certainly showing disinflation 2.9% -> 2.7% -> 2.1% -> 0.1% and reveals that deflation is around the corner.
Thursday, July 29, 2010
The story of the noose that choked credit
Banks and corporations have been going through their own credit crunch which is why risk aversiveness has been an underlying theme in this recessionary charade.
Commercial Banks heavily rely on nontransaction deposits for funding. These include small and large time deposits:

Repurchase agreements are an important source of bank funds and the most important lenders are corporations which means corporations are lacking idle funds and taking on a more defensive position:

Also Securitization made credit available on a mass scale:

Commercial Paper market had also become a major source of corporate funds:

We are not going to see any growth whatsoever unless funds get allocated from savers to borrowers, and by the looks of it our situation is morbid at best. Show me the money!
Wednesday, July 28, 2010
Durable Goods and Core-New Orders
So what exactly are durable goods?
They are products that have a life expectancy of at least three years (i.e. Macbook Pros, General Motors automobiles, washing machines, hair dryers?, IPhones, Gulf Stream V's ect.) From this we get the accurate sense that many important sectors of the economy are tied to durable goods production (i.e. employment, industrial production, profits, and productivity). Also this report serves as a behind the scenes sneak preview to the comprehensive factory orders report, which includes both durable and nondurable goods.
This report is based on results obtained from 3,500 manufacturers representing 89 industry categories. All the numbers are seasonally adjusted but not annualized, and its only in nominal terms(aka the dollar amounts are not adjusted for inflation). To estimate real changes in durable goods orders compare the growth rate over time with the performance of the producer price index.
The report can be found here.
This release is divided into 4 main sections: new orders, shipments, unfilled orders, and total inventories.
Table 1: Durable Goods Manufacturers' Shipments and New Orders
New Orders Decreased 1% or 2 billion to 190.45 billion. A persistent decline in new orders is ominous as it suggests that some factories may go unused. But we have to keep in mind that this data can be misleading because of a single large military purchase or transportation order. So we will also want to look at at the rows excluding defense (still a 0.7% drop in new orders) and transportation (.6% drop in new orders) and we find that the drop in new orders is less with these more volatile components removed.
Now with a little bit of common sense we can calculate new orders excluding defense and transportation. Let's call it "Core-New Orders" which like core cpi excludes the most volatile components.
"Core-New Orders"(in millions) for June:
132,536 = 190,490 - ((190,490 - 144,571(excluding transportation)) + (190,490 - 178,455(excluding defense)))
In May they were:
132,678 = 192,455 - ((192,455 - 145,420 (excluding transportation)) + (192,455 - 179,713 (excluding defense)))
The percentage change from last month was:
(( 132536 - 132678 ) / 132678) x 100 = -.11%
Certainly this is not as dramatic of a fluctuation as the standard new orders measure. Therefore this helps us realize that new orders hasn't fallen off the cliff and that although consumer demand is cutting back it is not as devastating as the standard number has you believe. Something I found interesting is the two conflicting titles that WSJ put out today. Real Time Economics highlights the positives:
Economists React: Encouraging Details in Durables
and WSJ Economy makes it clearly sound like a volatile downward turn:
Durable-Goods Orders Slide
Tuesday, July 27, 2010
Revised to be relevant and useful: TIPS and Inflation Expectations
In a previous post I calculated expected inflation using some bond that was maturing in 2012 but we want to get a more accurate (and relevant) picture of expected inflation. To do this we can go to the Federal Reserve and observe statistical release H.15 which are selected interest rates. For example, 10 years from July 22nd expected inflation is:
E(p)= i - ir
Where E(p) is expected inflation,
i - nominal interest rate ( interest rate paid on nominal treasuries)
ir - real interest rate (remember the inflation index bonds are supposed to reflect these)
Looking at the statistical release if we want the 10 year inflation expectations we must look at the 10 yr bonds. We will find that for July 22, 2010:
i (Nominal Treasury) = 2.9%
ir (Inflation indexed Treasury) = 1.78%
2.96% -1.78% = 1.18%
E(p) = 1.18%
Therefore expected inflation for the next 10 years as of July 22nd is 1.18%
Saturday, July 24, 2010
Initial Unemployment Claims: Still Super High
Initial claims for unemployment insurance remains super high like Oakland, California:

This is super bad. The number of people filing for unemployment benefits has remained at a high level which is a sign that our economy is still feeling the pain. Initial claims are still above 400,000 which is indicative of an economy that's still losing steam (womp! womp!).

This is super bad. The number of people filing for unemployment benefits has remained at a high level which is a sign that our economy is still feeling the pain. Initial claims are still above 400,000 which is indicative of an economy that's still losing steam (womp! womp!).
TIPS: A Gauge Of Inflation Expectations
Treasury Inflation Protection Securities or TIPS, are indexed bonds or bonds whose interest and principle payment are adjusted for changes in the price level. The interest rate on these bonds provides a direct measure of a real interest rate.
Using the Fisher equation:
i = ir + E(P)
where:
i - nominal interest rate
ir - real interest rate
E(P) - expected inflation
We can re-arrange the terms to get:
Expected inflation rate for the next 10 years = ( (i) - Ten Year Treasury Constant Maturity Rate, monthly) - ((ir)- 10 Year TIPS, Monthly)
Using FRED:

So the expected inflation rate for the next 10 years is around 3.2%.
Tuesday, July 20, 2010
Housing Market Summary: May not be in a Depression but this is still depressing
The housing market is barely breathing with housing starts and new one family houses sold at all time lows:

The S&P/Case-Shiller Index shows a dramatic decline in home prices nationwide:
 I could not resist throwing Detroit and Cleveland on there. It is going to be a long time before the consumer comes back in Detroit and Cleveland. Nationwide home prices seem to be stabilizing at a level not seen since 2003. The de-leveraging consumers that believe their home prices won't fall any further may start to feel financially healthier. Although I don't imagine the de-leveraging ending anytime soon.

The S&P/Case-Shiller Index shows a dramatic decline in home prices nationwide:

Thursday, July 15, 2010
What does a debt deflation entail and are we headed for one?
The process of debt deflation goes a little something like this:
Unemployment increases this leads to a sudden drop in income and more people filing for unemployment insurance. Suddenly people feel poorer and both home spending and consumer spending decline. Producer Prices then fall because business are cutting back on inventories. Furthermore, lower import prices also puts downward pressure on consumer and producer prices. Last but not least home prices continue to fall. Consumer prices then decrease due to lower input costs (via producer price index declines and import price declines) - this lower price level causes the real value of the debt burden to increase. This increased financial strain will lead to the next round of defaults and further reduction in consumer spending. This leads to more unemployment and even worse some unemployed 27 weeks or longer are no longer eligible for unemployment insurance. This leads to a further decline in incomes leading to more cash strapped households on the brink of desperation and another round of defaults as some (newly unemployed or uninsured laborers) are unable to make their debt payments.
Debt Deflation in the Economy:
Recession Hits ----> Unemployment (Increases) + Unemployment Insurance (Increases) ---> Income (Falls) -----> Spending (Falls)([Consumer Spending (Falls) + Home Spending (Falls)] )------> Price Level (Falls) ([ Producer Prices (Fall) + Import and Export prices (Fall) + Home Prices (Fall)]-----> Consumer Prices (Fall)] ) --> Real Debt Burden (Increases) --> Defaults (Increase) ---> Consumer Spending (Falls) --> Further Unemployment (Increases) + Unemployment Insurance (Fall)]---> Income (Falls) ----> Defaults (Increase) + Consumer Spending (Falls)---> and on and on
Lets look at the most recent evidence:
Unemployment has increased and those receiving unemployment insurance has decreased:

This is surely to have some more effects on the already depressed consumer and home spending:

The Producer Price Index has declined as of late to reflect the sharp cut back in production from businesses reaction to the lamesauce consumer demand:

Import prices have fallen recently:

Home spending and home prices continue to be trending downward:

Price deflation leads to an increased real debt burden and as we have seen defaults continue to be on the rise. As we have just seen some data suggest that this may be occurring and the fact that severe financial crisis do sometimes lead to debt deflation leaves me very worried. We would be experiencing a full-blown debt deflation right now if it wasn't for two things: sticky wages and unemployment insurance. The inflexible nature of wages allows those who do have jobs to keep spending. This - in addition to unemployment benefits - has prevented the severity of the crises from reaching the debt deflation stage. The governments ballooning debt has not been the work of bailouts but of unemployment insurance payments. This has represented a massive transfer of debt from the private to the public sector and the extension of these benefits have proved undeniably important for keeping our economy afloat.
Monday, July 12, 2010
Academia May Not Be For Me Afterall...
Greg Mankiw just discouraged me from taking a serious look at academia or from taking academics seriously for that matter. In other news a man with a sweater vest blog just jumped off the top of Schott Hall today. Hopefully the crises has taught these academics a thing or two. On a second thought: after reading this post I can only assume that some academic economists probably didn't even know a recession occurred.
The TED Spread: A Look At Financial Stress
The TED spread is the spread between the interest rates on interbank loans and short-term U.S. government debt. A rising TED spread is usually a precursor of a declining stock market because it means liquidity is being withdrawn. It is considered an indicator of perceived credit risk in the economy. When the TED spread increases it is a sign that lenders believe that the risk of default on interbank loans is increasing. This spread is also one of the components that make up the St. Louis Fed's Financial Stress index. The TED spread has been elevated upward since hitting a low back in March, indicating that perceived default risk is slowly increasing. This can be due to a host of issues ranging from Europe's fiscal woes to the recent onslaught of generally poor economic indicators. The spread can be observed via Bloomberg.
Sunday, July 11, 2010
FRED Graph Round-Up: Veggie Tales, Financial Woes, Manufacturing Blues, U.S. Debt and Financial Stress
FRED is an amazing resouce that cannot be taken for granted. FRED offers customizable graphs and allows the user to manipulate hundreds of time series data. Anything from vegetable import prices to foreign capital flows can be observed and presented in an attractive way.
Vegetable import prices keep rising as indicated by the following graph:

We can see that foreign investors are starting to see the U.S. as a financial safe haven. As Europe's fiscal woes ensue the United States is starting to look relatively safer:

The recession has hit manufacturing employment in the already ailing Michigan pretty hard:

A look at federal spending and revenue reveals that federal expenditures keep rising while total tax receipts have dropped significantly due to the persistently high unemployment and general contraction in business activity. The difference is payed for by issuing treasuries thus increasing our federal debt.

The St. Louis Financial Stress Index measures financial stress and is updated each Friday. Notice how the index has been elevated recently:

Friday, July 9, 2010
GeoFRED: There's A Map For That
GeoFred offers many different data sets and map options. Want to see the housing price index by state? There is a map for that. Interested in manufacturing employment by state? There is also a map for that:


Research & Development: An Investment or Expense?
Apparently R&D is counted as an expense and not as an investment in the official calculation of gross domestic product (GDP). This was first brought to my attention by the Levi Institute Multiplier Effect Blog. One would think that research and development would be counted as investment which makes up a valuable component of GDP. According to the Bureau of Economic Analysis (BEA) counting R&D as an investment would have increased GDP 2.7% from 1998 to 2007. The new research from the Bureau of Economic Analysis concludes that:
"By treating R&D as investment, real GDP increased at an average annual rate of 3.0 percent over the period 1998-2007. As in previous periods, growth in R&D investment continued to track business cycles. R&D’s contribution to growth slowed in 2001 and 2002, recovered in 2003, and outpaced the expansion through 2007. In 2002, business sector R&D subtracted from growth, but was more than offset by contributions from the government and nonprofit sectors."R&D should be counted as an investment because it leads to innovation and growth. R&D has been overlooked and should be treated more seriously as increased R&D spending leads to greater productivity growth. It would also be valuable to track its role in business cycle fluctuations.
Thursday, July 8, 2010
Weekly Claims For Unemployment Insurance: Keep Your Eye Out For Criminals
Weekly Claims for Unemployment Insurance tracks new filings for unemployment insurance benefits.
Figures on new filings for unemployment benefits are released every week and are based on reports from state agencies. Because of this it is considered a good coincident indicator, or an indicator that actively reflects what is going on in the economy. Its also considered forward-looking because first-time claims can influence future economic activity. If a large number of workers are losing their jobs every week and applying for unemployment insurance, this will eventually doom consumer sentiment, slash spending, and cause business to cut back investments. If the number of people filing for unemployment benefits increases every week or remains at a high level, it indicates that the economy is struggling.
The report can be found here. First look at the Unemployment Insurance Data for Regular State Programs. The general rule of thumb has been that if first-time claims stand above 400,000 for several weeks, it is a symptom of an economy that losing traction and in danger of slipping into recession. Also this pace usually drives the unemployment rate higher. For their to be any meaningful jump in payroll employment, first-time claims must remain below 350,000. For July 3rd initial claims stood at 454,000 down -21,000 from 475,000 on June 26 from last week.
We want to look at the four-week moving average to smooth out the volatility of the weekly numbers. This was 466,000 for July 3rd which is down 1,250 from 467,250 June 26. The numbers have continued to remain at a very high level which is a bad sign for consumer confidence and spending.
Insured unemployment vs. total unemployment:

 Looking at this graph we can see the growing disparity between those unemployed and those receiving unemployment insurance benefits. Jobless workers collecting unemployment insurance at least have some money to spend, which can dampen the harmful effects of an economic downturn. If total unemployment rises at a faster rate than those collecting unemployment insurance, it means a growing proportion of people out of work may have to get by without any state financial support. This can lead to more people turning to the underground economy or crime for money. Furthermore, the stress facing many state budgets has led to a massive reduction in police forces. I'll be keeping my eye out for the hamburglar.
 Wednesday, July 7, 2010
Step into the shoes of the Federal Reserve
Short-term interest rates are at their all time lows and inflation is not a problem. Historically low short-term interest rates usually fuel the demand for credit, which usually leads to debt buildup and expansion. The Fed and other central banks are walking on a very tight rope (although it may not seem like it). Raise rates and attempt to prevent investors searching for the greatest yield from putting all their money in one place (in effect creating another destabilizing bubble somewhere). Or put another way: raise rates and brace yourself for deflation, increased bankruptcies, greater liquidity problems, less demand for goods, and higher unemployment. The popular (and I think correct) thing to advocate is to keep the federal funds rate at the zero bound and handle asset inflation with the Fed's new pistol: regulation. A pistol as opposed to an M-16 because the first round of regulation legislation seemed less than adequate. Many observers of the great recession have chosen to blame the Federal Reserve for keeping rates "too low for too long" in the past. Where are they now? What would they have to say about this? It's easy to criticize the Fed in hindsight but can you blame them right now? When we do have another bubble on this earth (and we will) and some famous economist claims that this is because the Fed kept rates "too low for too long" we must remember what kind of downside risks our economy is currently facing. Before we blame the Fed in hindsight, we must remember what the newspapers, literature and economists were preaching at the time.
For a great source of ideas on this topic Raghu Rajan has got it going on.
For a great source of ideas on this topic Raghu Rajan has got it going on.
Overleveraged and Overburdened: American's Are Filing For Bankruptcy
In a previous blog post, I pointed out that the amount of credit card debt held by Americans has fallen substantially. The reason for this is that more Americans are filing for bankruptcy to reduce the amount of debt that they owe. This WSJ Real Time Economics post says it all. A new report by the American Bankruptcy Institute says that bankruptcy filings have reached their highest level since the Bankruptcy Abuse Prevention and Consumer Protection Act of 2005. Through the first six months of 2010 consumer bankruptcy filings increased to 770,117.
The explanation given and where bankruptcy will be heading:
 The latest data is not reflected in the graph but imagine one more bar for 2010 and imagine it being taller than that of the 2005 peak. Everyone who reads this needs to check out the interactive graphs and resources that the American Bankruptcy Institute provides.
The explanation given and where bankruptcy will be heading:
"Years of rising consumer debt and low savings rates, combined with the housing and unemployment crises, are causing bankruptcy levels not seen since the 2005 amendments to the Bankruptcy Code," said ABI Executive Director Samuel J. Gerdano. "We expect that there will be more than 1.6 million new bankruptcy filings by year end."Bankruptcy might be the way to go because it will lessen the burden on the true spenders in the country and thus we may see a pick up in consumption that is directly related to the increased bankruptcy filings.
Monday, July 5, 2010
Strategic Defaulters: Villians or Heros?
The WSJ Real Time Economics blog is one of my favorites because it highlights things like this. Credit firm Experian and consultancy Oliver Wyman note that 355,00 people defaulted on their mortgages in the first half of 2009 even through they could pay. This ties in nicely with one of my previous posts about credit card defaults. Defaulting lightened the financial burden of these defaulters which consequently allows them to spend more. But as the WSJ points out:
"Still, the data highlight the fact that the supply of strategic defaulters isn’t endless. Reneging on debts can provide a boost, but it’s no way to build a lasting recovery."So should we look down on these people for reneging on their obligations to pay? Or should we look to these people to spend their way to our recovery?
Wednesday, June 30, 2010
Chicago Purchasing Managers Index: Demand For Oil Dispersant Is Outstripping Supply
The Chicago Purchasing Managers Index (or Chicago Business Barometer) measures business activity in the Midwest. The Chicago Business Barometer is an extremely timely index as it comes out right before the ISM manufacturing index (which comes out tomorrow). On a month-to-month basis this index moves about 60% of the time with the ISM manufacturing index with a correlation close to 90% in the size of the change.
ISM-Chicago, an affiliate with the Institute for Supply Management, questions about 200 purchasing managers from Illinois, Indiana and Michigan on business activity in their districts. Answers received are compiled and a diffusion index is produced based on a weighted average of the five sub-component indexes:
1) new orders - 35%
2) production - 25%
3) order backlogs - 15%
4) employment - 10%
5) supplier deliveries - 15%
How does one go about interpreting this index?
The diffusion index functions like the ISM manufacturing survey index:
A reading above 50 indicates expansion, while one below 50 hints at contraction
Here is what the latest report has to say:
In a look at how the Gulf Coast Oil spill has impacted the Midwest economy, one of the general comments at the end of the report noted that demand is outstripping supply for the chemicals used to create oil dispersant:
ISM-Chicago, an affiliate with the Institute for Supply Management, questions about 200 purchasing managers from Illinois, Indiana and Michigan on business activity in their districts. Answers received are compiled and a diffusion index is produced based on a weighted average of the five sub-component indexes:
1) new orders - 35%
2) production - 25%
3) order backlogs - 15%
4) employment - 10%
5) supplier deliveries - 15%
How does one go about interpreting this index?
The diffusion index functions like the ISM manufacturing survey index:
A reading above 50 indicates expansion, while one below 50 hints at contraction
Here is what the latest report has to say:
"The Chicago Purchasing Managers reported the CHICAGO BUSINESS BAROMETER indicated the breadth of expansion showed little change, and chalked up a ninth month of growth."The index read 59.1 for June as compared to 59.7 in May, which means that although business is still growing it is growing at a slower rate than last month.
In a look at how the Gulf Coast Oil spill has impacted the Midwest economy, one of the general comments at the end of the report noted that demand is outstripping supply for the chemicals used to create oil dispersant:
"There has been an increase in order time for products which are purchased to make finished products. This is related to the chemical industry and the requirements for many components used in finished fluids for oil dispersants used in the Gulf Coast Oil spill."
Tuesday, June 29, 2010
What's Confidence?
The Conference Board Consumer Confidence Index (CCI) fell sharply in June. The index fell 9.8 points from 62.7% in May to 52.9 in June. If you turn on CNBC you will notice a small panic and talk of supporting stimulus programs. This is a pretty good sign that the recession is about to get nasty. Also a look at the yield curve reveals that a contraction is forthcoming.
S&P Case-Shiller Home Price Index: Your Home Is Still Pretty Much Worthless
The S&P/Case-Shiller home price index tracks monthly changes in the value of residential real estate in 20 metropolitan regions across the U.S. This index is based off of repeat transactions meaning it tracks the same homes from month-to-month and is calculated as a 3 month moving average to smooth out the volatility in the series. The index is published with a two month lag so timeliness is a factor. The latest report can be located here.
This quarterly index captures approximately 75% of U.S. residential housing stock by value and covers single-family home prices for the nine U.S. Census divisions. In addition, the 10 and 20 city composite indices also measure single family home prices and are calculated monthly. Furthermore, the condominium indices track condominium prices in Boston, Chicago, Los Angeles, New York, and San Francisco.
The repeat sales methodology used for the monthly index can be found here:
 Nationwide home prices seem to be improving:
This quarterly index captures approximately 75% of U.S. residential housing stock by value and covers single-family home prices for the nine U.S. Census divisions. In addition, the 10 and 20 city composite indices also measure single family home prices and are calculated monthly. Furthermore, the condominium indices track condominium prices in Boston, Chicago, Los Angeles, New York, and San Francisco.
The repeat sales methodology used for the monthly index can be found here:
"The repeat sales methodology measures the movement in the price of single-family homes by collecting data on actual sale prices of single-family homes in their specific regions. When a home is resold, months or years later, the new sale price is matched to its first sale price. These two data points are called a “sale pair.” The difference in the sale pair is measured and recorded. All the sales pairs in a region are, then, aggregated into one index. Sales pairs are carefully screened for any data points that would distort the index, such as non arms-length transactions."In layman's terms::
"The monthly S&P/Case-Shiller Home Price Indices use the “repeat sales method” of index calculation – an approach that is widely recognized as the premier methodology for indexing housing prices – which uses data on properties that have sold at least twice, in order to capture the true appreciated value of each specific sales unit."Here is Detroit's depressing HMI:

"Data through April 2010, released today by Standard & Poor’s for its S&P/Case-Shiller Home Price Indices, the leading measure of U.S. home prices, show that annual growth rates of all 20 MSAs and the 10- and 20-City Composites improved in April compared to March 2010. The 10-City Composite is up 4.6% from where it was in April 2009, and the 20-City Composite is up 3.8% versus the same time last year. In addition, 18 of the 20 MSAs and both Composites saw improvement in prices as measured by April versus March monthly changes."But this is not true because these numbers still reflect the effects from the home buyer tax credit. Because of this next months release should shed some more light on the true state of home values.
Subscribe to:
Posts (Atom)