Today we are looking at the
National Association of Home Builders/Wells Fargo Housing Market Index. This index is of interest because of its timeliness (released the same month it reports on) and ability to foreshadow other important housing indicators (like the Census Bureau's next day release of housings starts). It also has a proven track record of being a decent leading indicator of future home sales. How does one go about interpreting this index? Any index number above 50 is interpreted as "there are more builders who view conditions as good than there are builders who view conditions as poor." Any number below 50 and we have more builders viewing conditions as poor than those who see conditions as good.
There are three main components to the Housing Market Index (HMI):
(
Table 3. NAHB/Wells Fargo National HMI Components History)
1) Single-Family Sales: Present
This section usually does a better job of predicting housing starts in the short term (next couple months) than the official HMI. This index number is back down to 17 in June after hitting 23 in May, this verifies that the housing industry is still getting pounded. This also reflects that the small glimmer of hope that the home buyer tax credit brought is now gone.
2) Single-Family Sales: Next 6 Months
This reflects future expectations of single-family home sales over the next 6 months given current assumptions on economic growth and interest rates. The next six months looks bleak as well as we see a downward movement in the index from 27 in May to 23 in June.
3) Traffic of Prospective Buyers
This number gauges the number of buyers walking onto new home sites. With this index reading of 14 housing conditions will be mute for sometime to come.
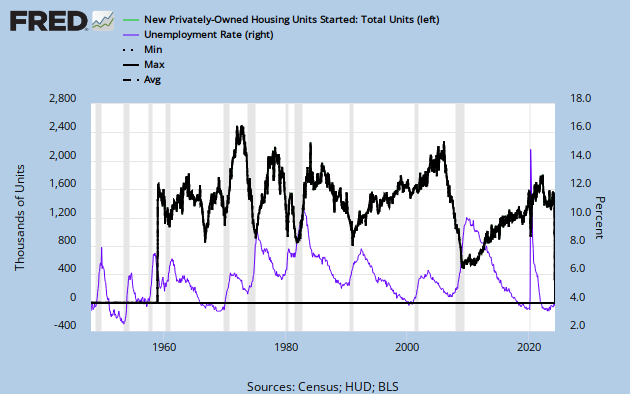
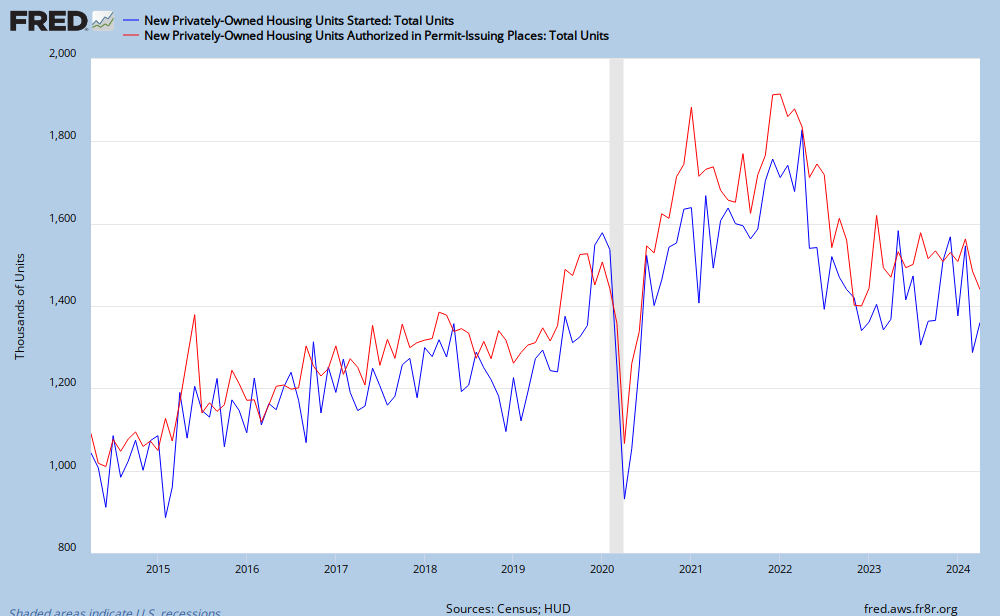
By looking at today's HMI we can get a feel for what the Census Bureau's housing starts will look like.
The Census Bureau will release housing start data tomorrow at 8:30 a.m. The feeling I get (based off of todays HMI) is that the housing start numbers will be really weak.