Showing posts with label Financial Indicator. Show all posts
Showing posts with label Financial Indicator. Show all posts
Monday, July 12, 2010
The TED Spread: A Look At Financial Stress
The TED spread is the spread between the interest rates on interbank loans and short-term U.S. government debt. A rising TED spread is usually a precursor of a declining stock market because it means liquidity is being withdrawn. It is considered an indicator of perceived credit risk in the economy. When the TED spread increases it is a sign that lenders believe that the risk of default on interbank loans is increasing. This spread is also one of the components that make up the St. Louis Fed's Financial Stress index. The TED spread has been elevated upward since hitting a low back in March, indicating that perceived default risk is slowly increasing. This can be due to a host of issues ranging from Europe's fiscal woes to the recent onslaught of generally poor economic indicators. The spread can be observed via Bloomberg.
Friday, June 11, 2010
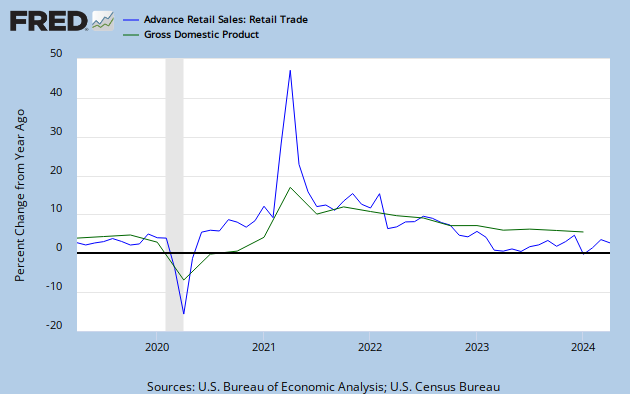
A look at the Advanced Retail Sales Numbers
The U.S. Census puts out a report each month called the Advance Monthly Sales For Retail Trade and Food Services. Why should we as economists care about what this report says? I generally try to care about any report that the Fed deems important. So why does the Fed look at retail sales??? Retail Sales is used to compute Personal Consumption Expenditures, which is the most important component of calculating the nation's GDP. Changes in real GDP correlate well with changes in real retail sales.
One thing to keep in mind is that retail sales is only measured in nominal terms, which means that no adjustment is made for inflation. This makes it difficult to tell whether a jump in the numbers came from consumers actually purchasing more or paying more to cover higher prices charged by retailers. Also the initial retail sales releases tend to be extremely volatile and thus misleading. This is partially because the advanced estimates are based on a relatively small sampling size. A three month moving average of the data provides a more accurate picture of whats occurring in the economy. For a look at the percentage changes go to table 2A which shows that retail sales dropped 1.4% in May but is still up 7.4% from last May. If you exclude motor vehicle sales and auto-related products (which tend to be extremely volatile) we see that the fall in the retail sales numbers is by a smaller 1.1% which (according to this number) is still up 6.1% from last May. So what exactly are U.S. consumers purchasing? Apparently gasoline which is up in usage 20.2% since last May (although this increase may represent an rise in gasoline prices). Furthermore, we see that the end of the April 30th homebuyer tax-credit brought about a drop in demand for building materials( -9.3% drop from last month). Overall the report is generally a disappointment among the economics community (check out WSJ's Economists React: 'Weaker Underlying Picture Revealed' for Consumer) as it suggests we have a struggling consumer. The Census Bureau should track polo hat sales: If demand for ridiculous items picks up then the "true American consumer" will be perched back up on their throne.
One thing to keep in mind is that retail sales is only measured in nominal terms, which means that no adjustment is made for inflation. This makes it difficult to tell whether a jump in the numbers came from consumers actually purchasing more or paying more to cover higher prices charged by retailers. Also the initial retail sales releases tend to be extremely volatile and thus misleading. This is partially because the advanced estimates are based on a relatively small sampling size. A three month moving average of the data provides a more accurate picture of whats occurring in the economy. For a look at the percentage changes go to table 2A which shows that retail sales dropped 1.4% in May but is still up 7.4% from last May. If you exclude motor vehicle sales and auto-related products (which tend to be extremely volatile) we see that the fall in the retail sales numbers is by a smaller 1.1% which (according to this number) is still up 6.1% from last May. So what exactly are U.S. consumers purchasing? Apparently gasoline which is up in usage 20.2% since last May (although this increase may represent an rise in gasoline prices). Furthermore, we see that the end of the April 30th homebuyer tax-credit brought about a drop in demand for building materials( -9.3% drop from last month). Overall the report is generally a disappointment among the economics community (check out WSJ's Economists React: 'Weaker Underlying Picture Revealed' for Consumer) as it suggests we have a struggling consumer. The Census Bureau should track polo hat sales: If demand for ridiculous items picks up then the "true American consumer" will be perched back up on their throne.
Tuesday, June 8, 2010
Index of Small Business Optimism and the Aggregate Demand Dilemma
The National Federation of Independent Business Index of Small Business Optimism increased 1.6 points in May with a reading of 92.2. The analysis states that although this is not a strong sign of recovery, it is nevertheless headed in the right direction. It is recorded as the best reading since September 2008. A look inside the report reveals that only one percent of small business owners plan on increasing employment, but this is still better than in April. An important insight into how this recessions recovery compares (lags behind) to those of the past:
"Since the third quarter of 2009, job creation plans have seriously underperformed the recoveries from the other two deep recessions covered by the NFIB survey. Coming out of the milder 1991 recession, construction added more than 100,000 jobs and 20,000 new firms in a year's time."Credit conditions are of special interest in the report and point to very slow improvement. A net 13 percent of NFIB members reported loans harder to get than in their last attempt, which is down one point from April. The main reason for small businesses owners not hiring or expanding their business is because of the lack in aggregate demand as ninety-two percent of the owners reported all their credit needs met, or they did not want to borrow.
"Very weak plans to make capital expenditures, to add to inventory and to expand operations make it clear that many good borrowers are simply on the sidelines, waiting for a good reason to make capital outlays and order inventory and take out the usual loans used to support these activities."The report makes the claim that what businesses need are customers, giving them a reason to hire and make capital expenditures and borrow to support those activities. Indeed, thirty percent cited weak sales as their top business problem, which is up one point from April.
Saturday, June 5, 2010
The Employment Situation and the Double Dip
Markets reacted wildly to the disappointing employment numbers released by the BLS yesterday. The Dow dropped 323 points to a new year low and mass panic about the stability of the recovery has ensued. Economist reactions included disappointment and fear as the jobs report indicated an extremely weak recovery. The number looked at most was the monthly change in non-farm employment from the establishment data. This data usually does generate excitement in the bond and stock markets because it provides the strongest evidence as to whether the economy is creating jobs. It is important to look at total private job creation as that is the best indicator of the economies true direction. If you looked at just the total non-farm you would have seen that 431,000 jobs were created in May. This is misleading however because 390,000 of those were jobs created by the government (temporary Census workers) and only 41,000 created by the private sector. This number was terribly disappointing because it was down from 218,000 private sector jobs created in April which indicates that the economy is slowing down. The markets should have also looked at the slowly increasing average weekly hours which signals that business may accelerate hiring in the distant future. Delving deeper we see that overtime hours are in fact rising and have broken the 4 hour mark in May. Rising overtime hours is a precursor to new permanent hires because overtime can be quite costly for a company. Traditionally less than 4 hrs a week for a few months has indicated that layoffs may increase while above 4.5 hours usually indicates that increased hiring we be coming around the corner. Another thing to look at is weekly claims for unemployment insurance which has shown an ability to predict when the economy approaches a turning point. Initial unemployment insurance claims have been steadily falling since its peak in early 2009, but has seemed to level off around 460,000 which indicates that the economy is still weak and in danger of slipping back into contraction (possibly a double dip). A general rule of thumb is that when first-time claims stand above 400,000 for several weeks the economy may be in danger of slipping into a recession. A number below 400,000 suggests a recovery in underway and companies are laying off fewer workers.
 The above graph shows the two recessions of the early 1980's where initial unemployment claims originally leveled off slightly above 400,000 before the economy slipped into another contraction. I have a feeling that maybe the same thing will happen in the most recent scenario given that the economy is still in a very fragile state.
 Initial unemployment insurance claims have been steadily falling since its peak in early 2009, but has seemed to level off around 460,000 which indicates that the economy is still weak and in danger of slipping back into contraction (possibly a double dip). A general rule of thumb is that when first-time claims stand above 400,000 for several weeks the economy may be in danger of slipping into a recession. A number below 400,000 suggests a recovery in underway and companies are laying off fewer workers.
 The above graph shows the two recessions of the early 1980's where initial unemployment claims originally leveled off slightly above 400,000 before the economy slipped into another contraction. I have a feeling that maybe the same thing will happen in the most recent scenario given that the economy is still in a very fragile state.
Subscribe to:
Posts (Atom)