Showing posts with label the employment situation. Show all posts

Friday, February 3, 2012

Employment Situation: An Inside Look

Check out the divergence between those unemployed from ages 20-24 and those aged 25-34. Currently there are about 1,000,000 more people that are unemployed in the 25-34 age bracket than in the 20-24 age bracket.


These values used to coincide but now the spread between them is widening which suggests that younger people may have an advantage when it comes to getting hired.  They're less picky and more willing to accept anything that has some dollar signs attached to it versus the older and more demanding unemployed member of society. In the graph below the blue line represents those aged 25-34 that are unemployed and the black line is for 20-24 age range.


Check out the below graph which shows the unemployment rate for those over 25 with a bachelors  degree, those without one and those that didn't graduate high school.  Getting a bachelors is not a sufficient condition for employment but as the  graph below shows, you do have greater job security.
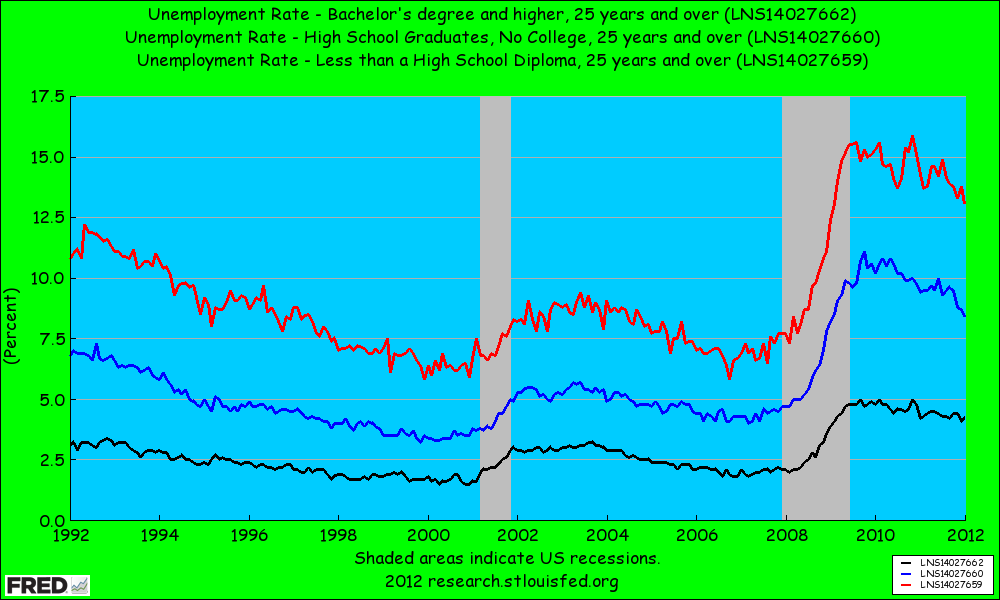

Additionally, check out the spread between those with a bachelors and those who graduated high school. Notice how this spread has widened.  This suggests that those with bachelors are certainly less susceptible to economic fluctuations and that getting through those student loans is definitely worth it.


The unemployment rate for those who graduated high school is currently 4% higher than those that got their bachelors. Lesson of the day: Read more books and get some education. I got to keep dancin' and so should you!

Steven J.

Friday, January 6, 2012

Civilian Unemployment: Persistence

Today the Civilian Unemployment numbers were released and all they did was verify one thing- that recoveries in the United States since 1990 have been jobless ones.  Check out the following graph which takes every post WW2 recession and averages their numbers from peak to 27 months out. Notice that this one has the greatest persistence of all of them in terms of a high unemployment rate.


Additionally check out the next graph which just uses the recessions from 1990 and beyond. These are all the recessions that have been characterized by jobless recoveries. The thing to notice here is not the level of the unemployment rate, but that in these recoveries the unemployment rate also failed to drop significantly 27 months or so after the peak.  This recession has been deeper (a cyclical factor) which explains why unemployment is so freakin' high, but unemployment being persistent has nothing to do with cyclical factors- yet it seems more structural reforms may be necessary.  This isn't house lock people this is something more than that. This is the structure of unemployment benefits and the nature of profit seeking firms, that want to please shareholders.  Being lean and mean is attractive for companies that face constant uncertainty, especially when growth would be a miracle occurrence.


The last graph shows that while unemployment does still remain stubbornly high at least it is falling.  Although this may be because people are just plain dropping out of the labor force.  A closer look into the Employment Situation would be necessary to reveal the details.

keep dancin'

Steven J.

Friday, January 7, 2011

The Employment Situation

The employment situation is by far the most significant of all the major economic indicators.  The reasons include the data timeliness as it is literally released one week after the month being looked at and also the fact it includes data on household earnings and the job market which determines future spending.  

First thing to note is that the employment situation is broken up into two sections; the household survey and the establishment (or payroll) survey.  The household survey is essentially the government contacting 60,000 people each month, and from this data the civilian labor force along with how many of these people actually have jobs is calculated.  Furthermore, it is from the household survey that we derive the widely reported unemployment rate.  The establishment survey is considered to be a better employment measure than the household survey as its data comes directly from businesses, not households.  Each month the Bureau of Labor Statistics gets in touch with 400,000 companies and government agencies which are responsible for the employment of 40 million or so workers.  The following is a graph of total nonfarm payrolls (in thousands):
 One important thing to notice is the average number of hours worked in a week.  If the number of weekly hours increases for three consecutive months (aka the three month moving average is increasing), it is a strong signal that companies will soon accelerate hiring.  The same is true vice-versa, meaning if the three month moving average is declining then expect layoffs and cutbacks.  From the BLS employment situation report:
"The average workweek for all employees on private nonfarm payrolls
held at 34.3 hours in December. The manufacturing workweek for all
employees declined by 0.1 hour to 40.2 hours, while factory overtime
remained at 3.1 hours."
As the following graph shows average weekly hours have remained steady, indicating the economy is not going to be doing much on the hiring front:

Overtime hours are noteworthy because in times of economic uncertainty, rather than hiring new workers companies might ask their employees to work additional hours.  The catch is that overtime hours can be costly for a firm and so if there is a consistent upward trend in hours for 3 months firms are put under pressure to hire again. Changes in overtime manufacturing hours are considered particularly sensitive to fluctuations in demand. As the following graph shows over time hours have indeed increased but are still below pre-recessionary levels:

One of the best things to look at when seeking to reveal trends in future employment is temporary employment.  Companies often prefer to employ temporary help, due to lingering uncertainty I suppose, before taking the big daddy all in expensive step of permanently hiring and training new full-time employees.  Temps are cheaper and they give firms flexibility to add and reduce staff during these most certainly uncertain times.  The following graph paints the picture that firms are adding temps, but we have some time yet to see if this translates into any permanent hiring.
The source for the graph above is indeed the BLS and the data was extracted from the best site ever created- FRED.

The most recent employment situation reveals that the unemployment rate edged down to 9.4% and nonfarm payroll employment increased by a wompish 103,000 -considerably below expectations of around 150,000.  The drop from 9.8 to 9.4 in December, on the surface seems pretty great, however it may just reflect people leaving the labor force because they no longer receive unemployment benefits and consider themselves hopeless.  The WSJ real time economics blog highlights this change:
"The big drop in the overall unemployment rate and the U-6 measure was primarily due to a decline in the number of unemployed, which fell by 556,000 in December. That’s good news since the number of people who are employed increased by nearly 300,000. But that still leaves over 250,000 workers leaving the labor force altogether. That likely means a substantial part of the drop was due to workers giving up. Anyone unemployed over 99 weeks has no access to unemployment benefits and many lose access even earlier. Once those benefits expire, the unemployed may stop considering themselves part of the labor force."
Sudeep Reddy of the Wall Street Journal's Real Time Economics Blog makes at least one other interesting point claiming that at this pace we will have to wait until the 2020's before the unemployment rate hits 5% again:
"The economy lost almost 8.4 million jobs from December 2007 to December 2009. It added 1.1 million jobs in 2010. At December’s pace, just replacing the rest of those lost jobs would take 70 more months — roughly six years, taking us to November 2016...But the economy also needs to add 100,000 to 125,000 jobs a month just to keep pace with growth in the labor force... Even employment gains close to October’s pace (210,000 jobs) would take us into the next decade before seeing the unemployment rate back near 5%."
That's a bummer.  For considerably more analysis on the employment situation please read the Wall Street Journals Real Time Economics Blog.